Fig 6.
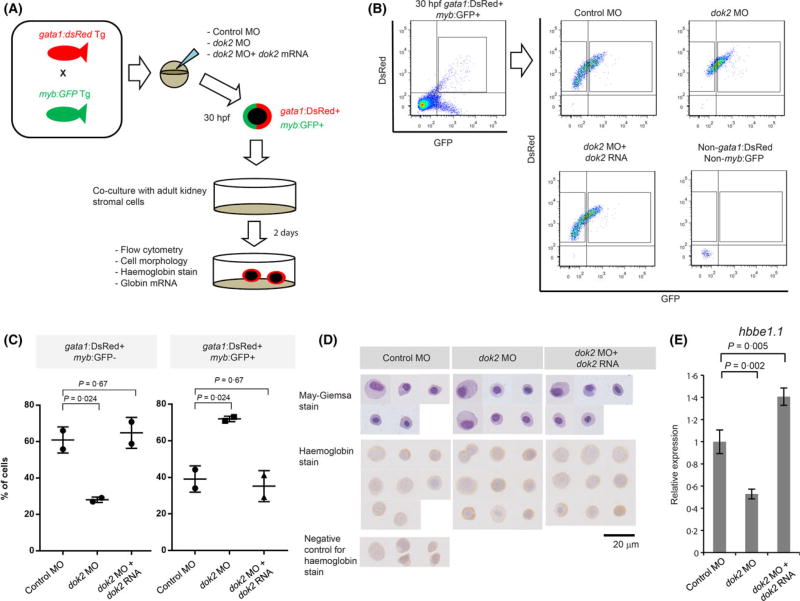
In vitro functional analysis of dok2. (A) Diagram shows experimental design. Adult gata1:dsRed Tg fish were crossed with myb:GFP Tg fish. After injecting dok2 MO, only DsRed+ GFP+ embryos were selected. Primitive erythroid cells and erythroid-myeloid progenitors (EMP, defined as gata1:dsRed+ myb:GFP+) were prepared from 30-hpf embryos and cultured on kidney stromal cells for 2 days. (B) Flow cytometric analysis of cultured floating cells. Shown are representative images of two independent experiments. (C) Shown are percentages of gata1:dsRed+ myb:GFP− cells and gata1:dsRed+ myb:GFP+ cells. Data is shown as mean ± SD calculated from two idenpedent experiments. (D) May-Giemsa and Haemoglobin staining of all cultured cells. Scale bar: 20 µm. (E) Expression of embryonic hbbe1.1 globin gene in gata1:dsRed+ myb:GFP− cells sorted from 2-day cultured cells. GFP, green fluorescence protein; MO, morpholino antisense oligonucleotide. [Colour figure can be viewed at wileyonlinelibrary.com]

