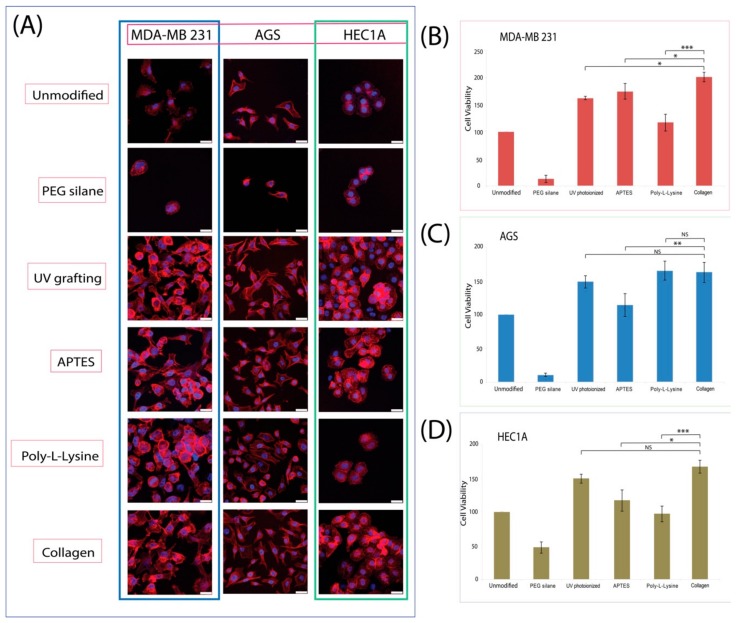
Figure 6.
(A) Confocal microscopy of the various cells (MDA-MB 231, AGS and HEC1A) on different modified surfaces. Their respective cell viability assay as illustrated on the right for (B) MDA-MB 231, (C) AGS and (D) HEC1A. Statistical significance is denoted as follows: * represents a p value ≤ 0.05, ** represents a p value ≤ 0.01, and *** represents p value ≤ 0.001, while NS represents a value not statistically significant.

