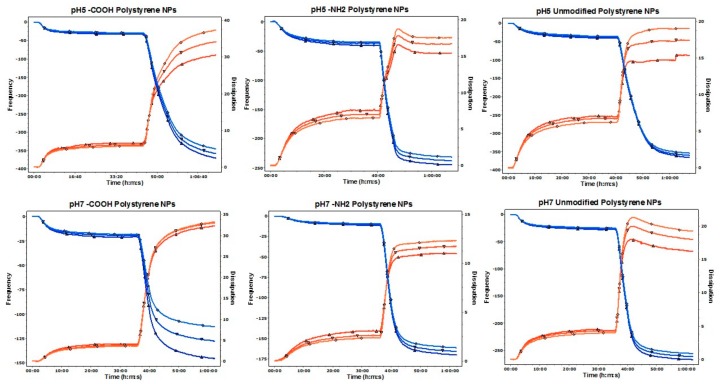
Figure 2.
Representative traces for frequency f and energy dissipation D recorded by the QSoft sofware at three diferent overtones (fifth, seventh, and ninth). Frequency is represented as a blue line and its values shown in the left axis. Dissipation is represented as a red line and its values are shown in the right axis.

