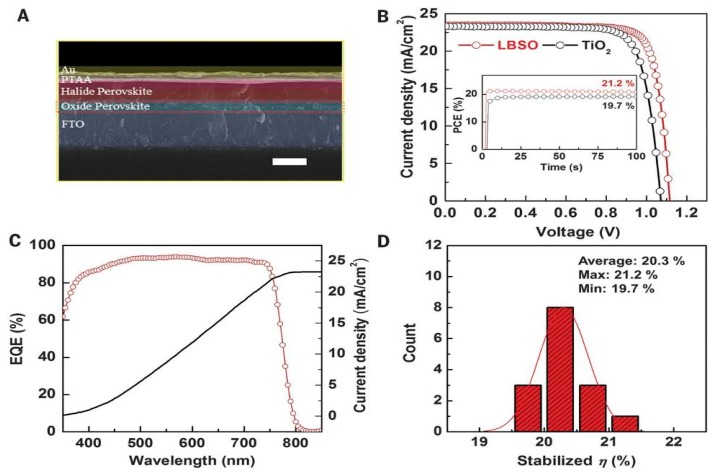
Figure 9.
Photovoltaic performance of PSCs (A) Cross-sectional SEM image of LBSO-based PSCs (scale bar, 500 nm). (B) J-V curves and (inset) stabilized power conversion efficiencies (PCEs) at a maximum power point (LBSO: 0.96 V; TiO2: 0.91 V) for the best LBSO- and TiO2-based PSC. (C) External quantum efficiency (EQE) spectrum and Jsc integrated from the EQE spectrum of the best LBSO-based PSC. (D) Histograms of PCEs extracted from an Isc stabilized at the maximum power point during 100 s for the LBSO-based PSCs (Reprinted with permission) [17].

