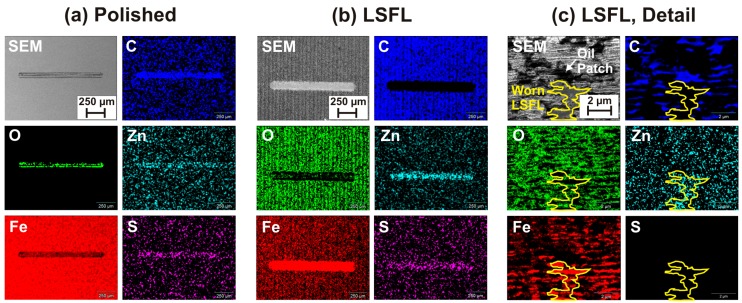
Figure 7.
SEM micrographs and corresponding EDX maps of the spatial distributions of the elements O, Fe, C, Zn, and S in the wear tracks associated with the COF measurements shown in Figure 5 (20,000 sliding cycles): (a) overview of the wear track on the polished surface; (b) overview of the wear track on the LSFL-covered laser processed surface; and (c) magnified detail within the wear track shown in (b) (EDX: (a,b) 5 kV; and (c) 3 kV)).

