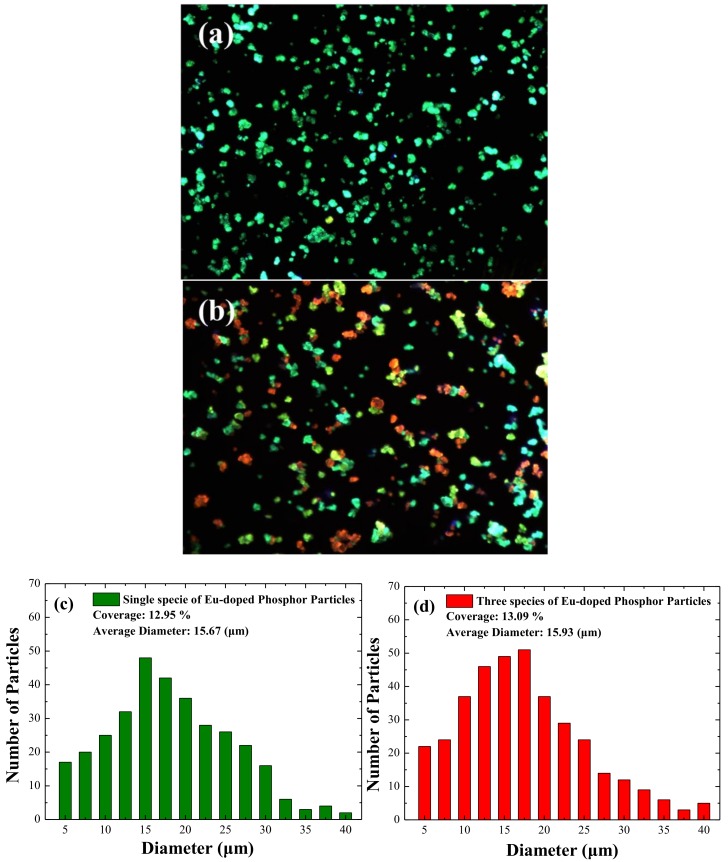
Figure 4.
Optical microscope images (100×) of LDS layer with (a) single species (specie-A); (b) combination of specie-A/specie-B/specie-C; (c,d) size distribution and coverage of phosphor particles respectively calculated using Image-J software from images in Figure 4a,b.

