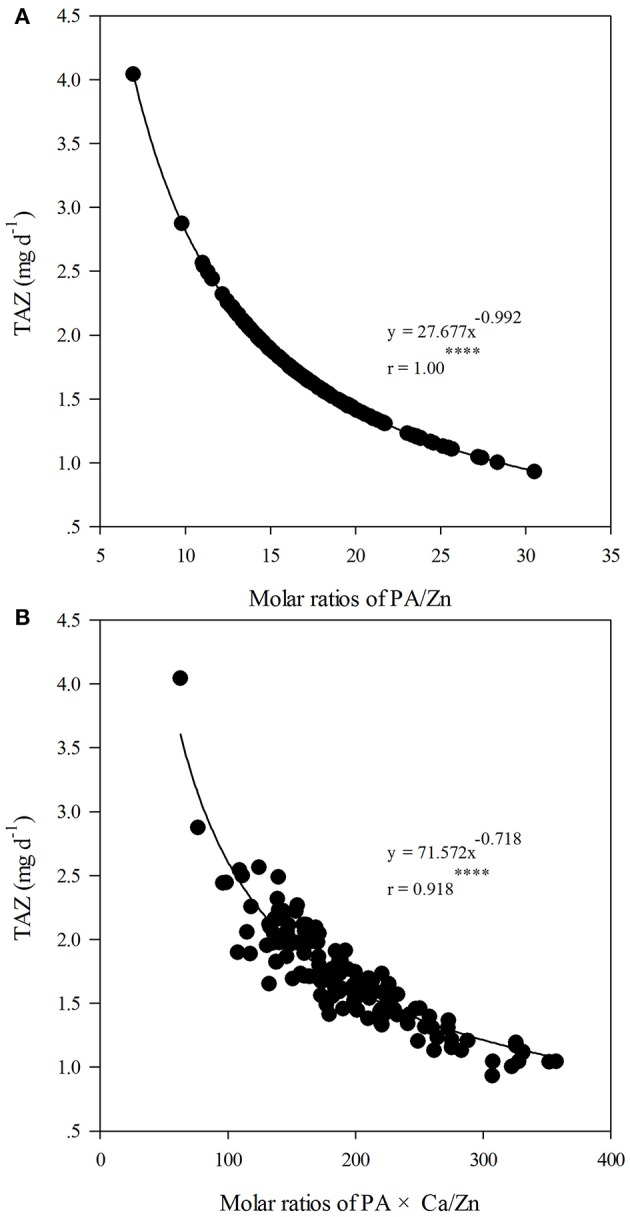
Figure 1.

Relationships between total daily absorbed Zn (TAZ, mg d−1) and molar ratios of phytic acid (PA)/Zn (A); and between TAZ and molar ratios of PA × calcium (Ca)/Zn (B) in whole flours across all treatments of nitrogen (N) application, cultivars and foliar spraying (n = 144). “****” indicates significant at P ≤ 0.0001.
