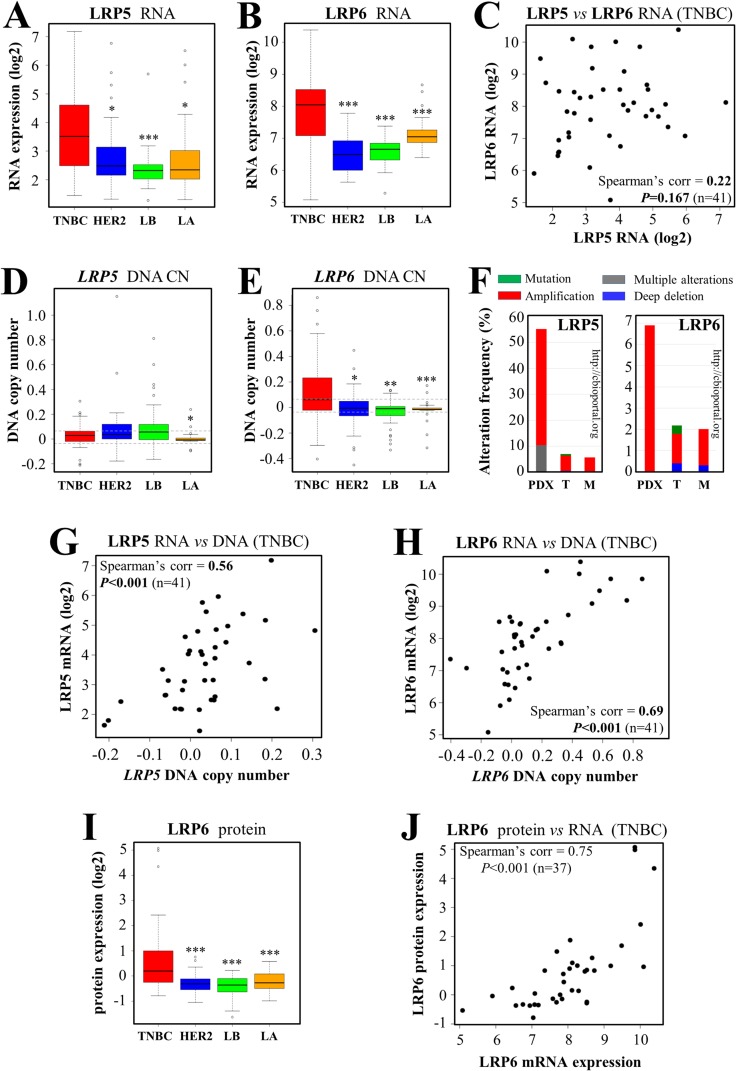
Figure 1. LRP5 and LRP6 are more strongly expressed in TNBC than in other breast cancer subtypes.
We assessed the expression of LRP5 and LRP6 in various subtypes of breast tumors from our cohort [46, 47]: TNBC, HER2+/ER- (HER2), luminal B (LB) and luminal A (LA) tumors. (A-B) RNA microarray analysis was performed to assess the levels of LRP5 (A) and LRP6 (B) mRNA. (C) Correlation between the levels of LRP5 and LRP6 RNA in the TNBC subgroup. Each TNBC tumor from our cohort (n=41) is represented by a dot. (D-E) DNA copy number (CN) of the LRP5 (D) and LRP6 (E) genes. The smoothed segmented copy number signal is presented in boxplots, with dashed lines indicating the thresholds retained for the detection of DNA CN gains and losses. (F) We queried the cBio Cancer Genomics Portal (http://cbioportal.org) [54, 55], to determine whether LRP5 and LRP6 were altered in breast cancer. The graphs imported from cbioportal show the changes in frequency for LRP5 (left panel) and LRP6 (right panel) in 3 publicly available breast cancer cohorts: patient-derived xenograft models (PDX) [58], TCGA (T) [56] and METABRIC (M) [57]. Color code: green: mutation; gray: multiple alterations; blue: deletion; red: amplification. (G) Correlation between LRP5 RNA levels and LRP5 DNA CN in TNBC. (H) Correlation between LRP6 RNA levels and LRP6 DNA CN in TNBCs. (I) LRP6 protein levels were assessed with a reverse-phase protein array (RPPA). (J) Correlation between LRP6 RNA and protein levels within the TNBC subgroup. Each tumor (n=37) is represented by a dot. The values obtained for the relative quantification of protein and mRNA were log-transformed and are shown as box plots (A-B, D-E, I). Outliers are shown within each population studied (open circles) (A-B, D-E, I). *P<0.05, **P<0.01, ***P<0.001 (comparisons with TNBC: A-B, D-E, I).

