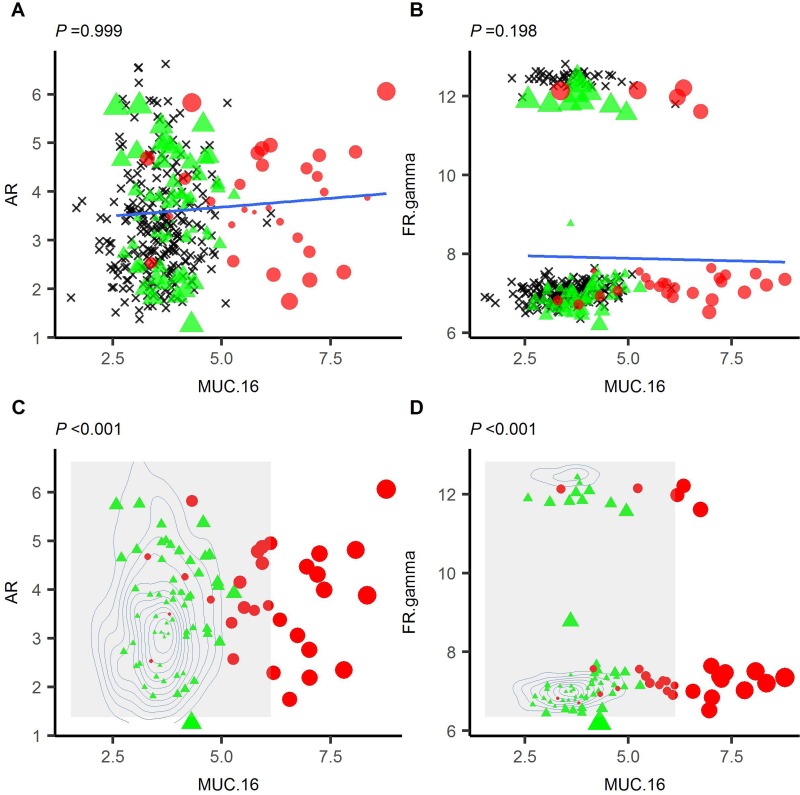
Figure 1. 2D-Kernal density estimation-based distance can differentiate cases (red circle) and controls (green triangle) where linear-regression based distance cannot.
Linear regression was plotted using a control set (black crosses) for MUC16 vs AR (A) or MUC16 vs folate receptor gamma (B). Cases and controls are then overlaid and the perpendicular distance from each point determined. It was not possible to differentiate cases from controls using the linear regression (P = 0.999 or 0.198 for AR or folate receptor gamma respectively). 2DKDE estimation of the same distributions was performed (C and D) and distance calculated for each case and control based on the density of the underlying distribution. In both cases, it was possible to differentiate cases and controls in this manner.

