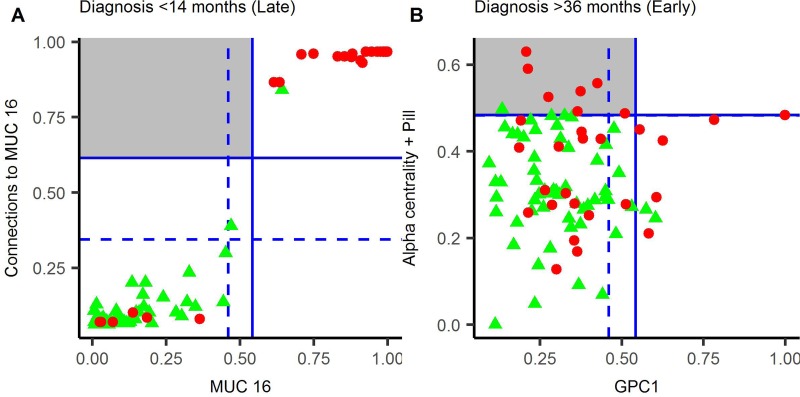
Figure 3.
Parenclitic-based models versus RDLG-models for late (A) and early (B) pre-diagnosis groups. The predicted value for each model is plotted with horizontal and vertical lines representing a diagnostic threshold giving 95% (dashed line) or 98% (solid line) specificity. Cases are represented by red circles and controls by green triangles, hence cases in the top left quadrant (grey square) were detected by the parenclitic-model only and cases in the bottom right quadrant by RDLG-models only. Points in the top right quadrant are detected by both models, OCP = oral contraceptive pill.

