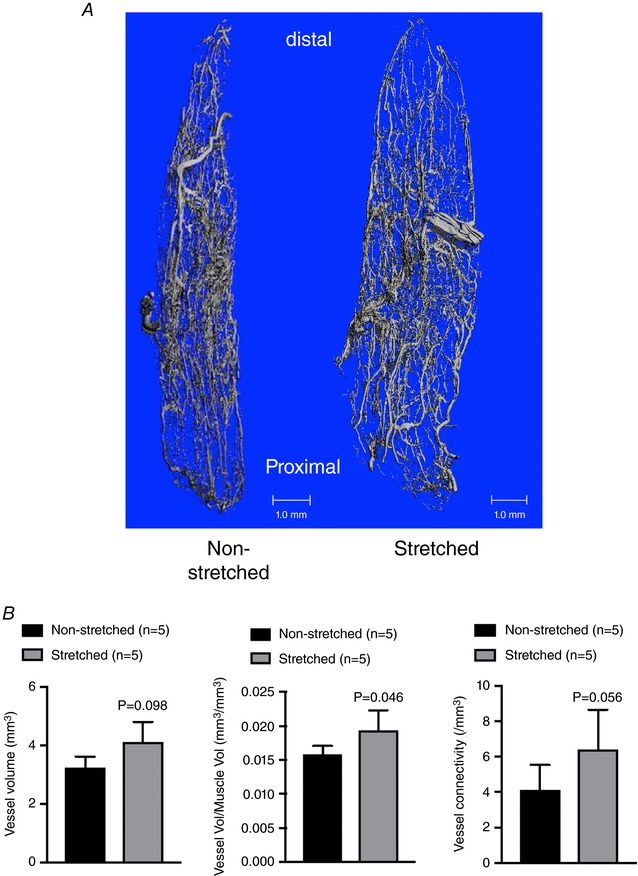
Figure 7. Micro‐CT analysis of microvascular parameters after 4 weeks of muscle stretching.

A, representative images of the soleus muscle microvasculature from the stretched and non‐stretched contralateral hindlimb. B, absolute vessel volume (mm3), normalized vascular volume (vascular volume/total muscle volume; mm3/mm3 and vessel connectivity in soleus muscles from stretched and non‐stretched contralateral limbs. n, number of rats; * P < 0.05 vs. non‐stretched contralateral limb. [Color figure can be viewed at http://wileyonlinelibrary.com]
