-
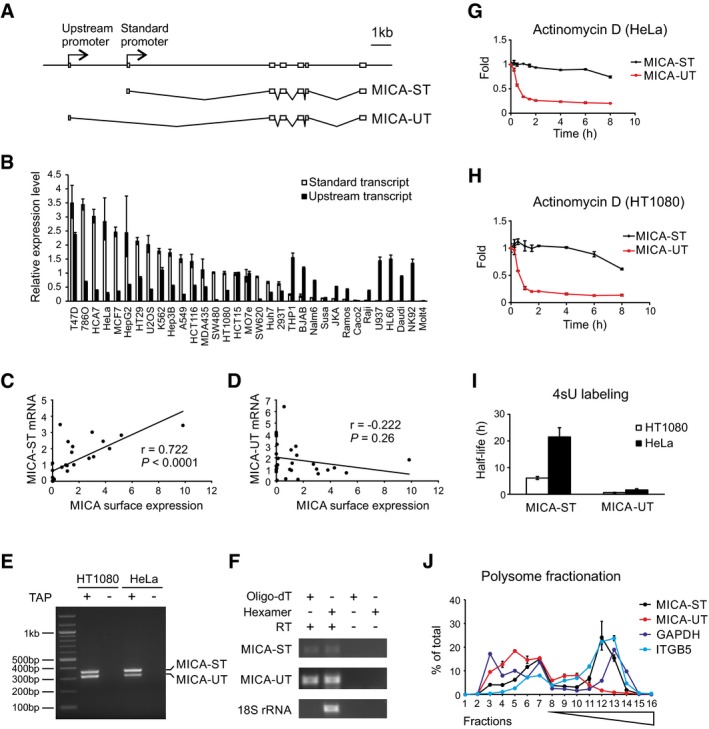
A
Exon structure of the MICA gene, standard transcript (MICA‐ST) and upstream transcript (MICA‐UT). In the upstream transcript, an alternative upstream first exon is spliced to exon 2 of the gene. Both transcripts share common downstream exons.
-
B
The upstream transcript and standard transcript levels measured by qPCR in different cells. Relative expression levels were normalized to that of the standard transcript in HT1080 cells and ranked according to expression of the standard transcript. Error bars represent standard deviations of three replicates.
-
C
Positive correlation between the level of the standard transcript and cell surface MICA expression in 28 different cell types.
-
D
No significant correlation was found between the level of the upstream transcript and cell surface MICA expression in these different cells. The Pearson's correlation coefficient r and associated P‐values are shown.
-
E
RLM‐RACE analysis of the upstream and standard MICA transcripts using a common primer in exon 2 demonstrates that both transcripts are 5′ capped. Samples prepared without tobacco acid pyrophosphatase (TAP) treatment were used as negative controls.
-
F
RT–PCR using hexamer or oligo‐dT primed cDNA shows that both transcripts are 3′ polyadenylated. Nonpolyadenylated 18S rRNA and the RT–PCR without reverse transcriptase (RT) were used as negative controls.
-
G, H
Stability of the upstream and standard MICA transcripts measured following actinomycin D treatment in HeLa cells (G) or HT1080 cells (H). Error bars represent standard deviations of three replicates.
-
I
Stability of the upstream and standard MICA transcripts measured by 4sU metabolic labelling in HeLa or HT1080 cells. Error bars represent standard deviations of three replicates.
-
J
Polysome profiling of the standard transcript (MICA‐ST), upstream transcript (MICA‐UT) and GAPDH and ITGB5 as controls in HT1080 cells. Distributions of mRNA across sucrose gradient fractions are shown. Numbers 1–6 represent ribosome‐free fractions, number 7 represents the monosome fraction, and numbers 8–16 represent polysome fractions with increasing number of ribosomes. Error bars represent standard deviations of three replicates.

