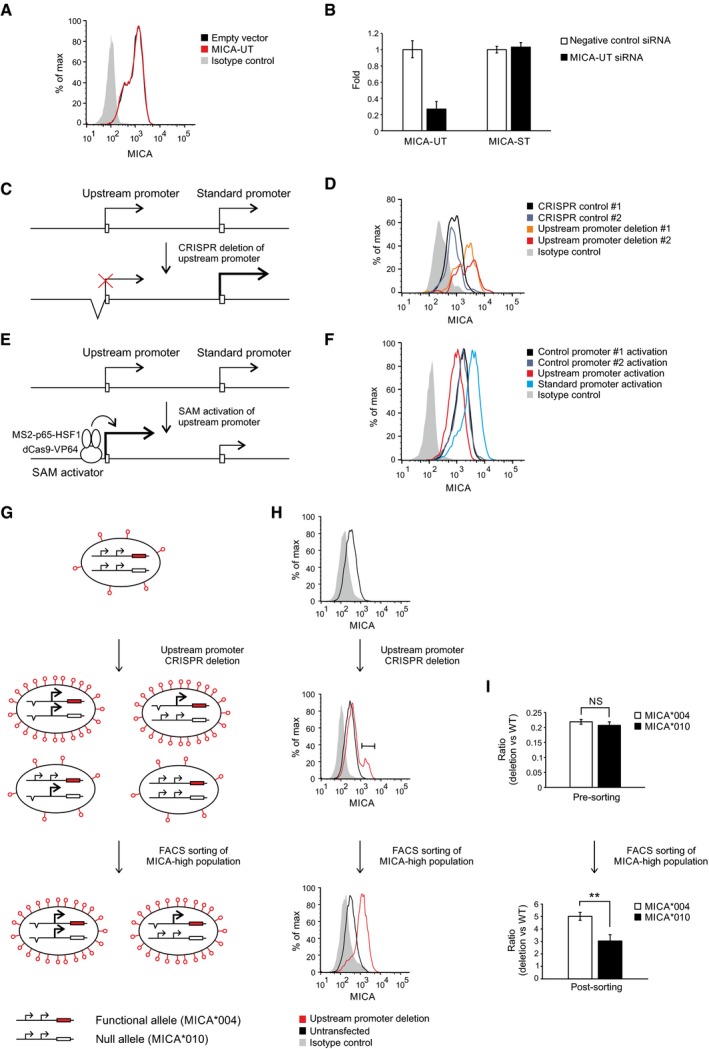
Flow cytometric analysis of MICA surface expression in 293T cells transfected with plasmids expressing the full‐length upstream transcript or empty vector control and the pEGFP‐N1 plasmid as transfection control. Cells were gated for the GFP‐positive population.
qPCR analysis of the upstream transcript and standard transcript in 293T cells transfected with siRNA targeting the upstream transcript or with control siRNA. Error bars represent standard deviations of three replicates.
Diagram of CRISPR deletion of the core upstream promoter.
Flow cytometry of cell surface MICA expression in primary human fibroblasts following transfection with CRISPR plasmids targeting deletions of the MICA upstream promoter or control genes (HLA‐B or PDPN). Cells were gated for the CRISPR Cas9 nuclease‐transfected GFP‐positive population.
Diagram of dCas9‐based transcriptional activation of the upstream promoter. The SAM transcription activator consists of dCas9 fused to a VP64 transcription activator and a guide RNA containing RNA aptamers that recruit multiple copies of the MS2 bacteriophage coat protein fused to a multidomain transcription activator derived from the p65 and HSF1 transcription factors.
Flow cytometry of cell surface MICA expression in 293T cells following transfection with SAM plasmids activating the MICA upstream promoter, standard promoter or control promoters (CD43 and CD36). Cells were gated for the transfected GFP‐positive population.
Schematic diagram representing the different possible genotypes that may arise and the associated phenotypes predicted by the in cis transcriptional interference hypothesis. Primary human fibroblasts were used which are heterozygous for the MICA*004 and MICA*010 alleles, of which only MICA*004 (red) reaches the cell surface. CRISPR deletion of the upstream promoter can result in three additional genotypes depending on whether one or both MICA alleles are affected. If, as we hypothesized, there is intragenic transcriptional interference, then deletion of the upstream promoter of the MICA*004 allele will result in upregulation of cell surface MICA expression, whereas deletion of the upstream promoter of the MICA*010 null allele will have no effect on cell surface MICA expression compared to wild‐type cells. Accordingly, cells sorted for upregulated MICA surface expression should be enriched for cells with deletion of the MICA*004 allele if transcriptional interference occurs in cis.
MICA surface expression of cells at different stages of the experiment. After CRISPR deletion of the upstream promoter, there is a population of cells with upregulation of MICA expression (middle panel) and this population was sorted for further analysis (lower panel).
PCR analysis of the CRISPR‐deletion genotype for each allele before and after sorting of cells with upregulated cell surface MICA expression. One of the differences between the MICA*004 and MICA*010 alleles is at SNP rs2596539 within the upstream promoter outside the deleted region, and this allows differentiation between the two alleles using restriction digestion prior to PCR amplification. As indicated by the genotype before sorting, CRISPR‐mediated deletion of the upstream promoter arises with equal frequency for both alleles (upper panel). However, consistent with the in cis transcriptional interference hypothesis, the cells that have high MICA*004 surface expression are enriched for deletion of the in cis MICA*004 upstream promoter compared to the MICA*010 upstream promoter (lower panel). The difference in the enrichment of MICA*004 compared to MICA*010 upstream promoter deletion is modest as the majority of the sorted cells have biallelic deletion. Error bars represent standard deviations of four replicates. NS not significant; **P < 0.01, Student's t‐test.

