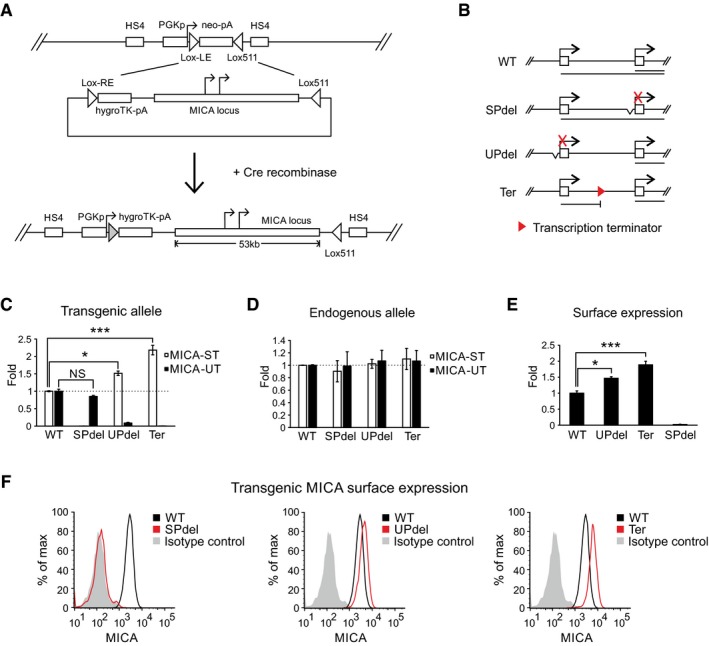
Figure 3. Transcriptional interference of the standard MICA promoter by the upstream promoter.

-
AGeneration of the site‐directed BAC reporter cell line. The acceptor cell line was generated such that it carries only a single copy of a landing site containing a neomycin‐resistance cassette under the control of a PGK promoter. The neomycin cassette was flanked by variants of LoxP sites (Lox‐LE and Lox511), and the entire inserted locus was insulated at both ends by HS4 insulators. The donor BAC constructs contain the MICA locus flanked on one side by a Lox‐RE site followed by a promoterless hygromycin‐resistance cassette, and on the other side by a Lox511 site compatible with the one in the landing site. Following co‐transfection of the donor BAC construct and a Cre recombinase expression plasmid into the acceptor cell line, the ensuing Cre‐Lox recombination results in irreversible exchange of the neomycin cassette in the cell with the insert containing the MICA locus from the BAC.
-
BDiagram of BAC constructs used to generate modified isogenic cell lines by recombinase‐mediated cassette exchange. Four different constructs were created: wild type (WT), deletion of the core standard promoter (SPdel), deletion of the core upstream promoter (UPdel) and insertion of a transcription terminator between the two promoters (Ter). The primary transcripts generated are shown below the constructs.
-
C, DTransgenic (C) or endogenous (D) MICA upstream and standard transcript expression measured by qPCR in modified isogenic cell lines carrying a transgenic 53‐kb MICA locus. Deletion of the upstream promoter or insertion of a transcription terminator between the promoters led to increased expression of the transgenic MICA standard transcript; no effect was seen on the endogenous transcripts. Error bars represent standard deviations of multiple independently generated clones (n = 2–4, Appendix Table S1). NS, not significant; *P < 0.05, ***P < 0.001, Student's t‐test.
-
E, FFlow cytometric analysis of transgenic MICA surface expression in isogenic cell lines carrying a transgenic 53‐kb MICA locus. Bar chart of mean fluorescent intensity is shown in (E), and histograms of representative clones in (F). Consistent with in cis transcriptional interference, expression of the transgenic MICA protein was upregulated by deletion of the upstream promoter or insertion of a transcription terminator between the two promoters. Error bars represent standard deviations of multiple independently generated clones (n = 2–4, Appendix Table S1). *P < 0.05, ***P < 0.001, Student's t‐test.
