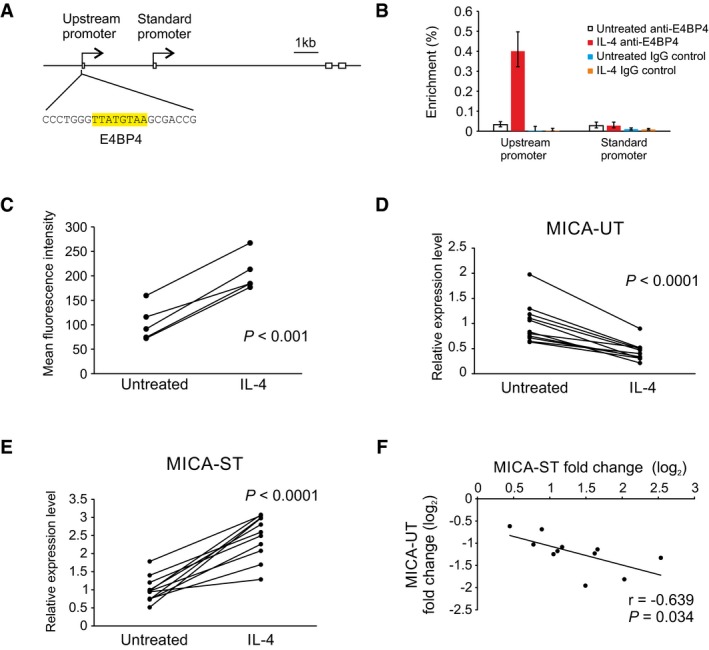
Figure 6. Regulation of MICA by IL‐4 through transcriptional interference.

-
ADiagram of the upstream promoter with the E4BP4 binding site highlighted in yellow.
-
BChIP analysis of the upstream promoter and standard promoter regions of the endogenous MICA locus for binding of the transcription factor E4BP4 in primary human B cells following interleukin‐4 (IL‐4) treatment. Interleukin‐4 causes substantial binding of E4BP4 to the upstream promoter, but not to the standard promoter. Error bars represent standard deviations of three replicates.
-
CMICA surface expression on primary human CD19+ B cells in PBMC from five different donors treated with interleukin‐4 (IL‐4) for 3 days. Cells were gated on the CD3−CD19+ population. Data shown are mean fluorescence intensity with the isotype control subtracted. P‐value is from paired Student's t‐test.
-
D–FInterleukin‐4 (IL‐4) treatment of primary human B cells from 11 donors reduced expression of the upstream transcript (D) and increased expression of the standard transcript (E). P‐values are from paired Student's t‐test. Linear regression (F) demonstrates a reciprocal correlation between changes in expression of the upstream transcript and of the standard transcript in response to interleukin‐4 treatment. Pearson's correlation coefficient r and associated P‐value are shown.
