-
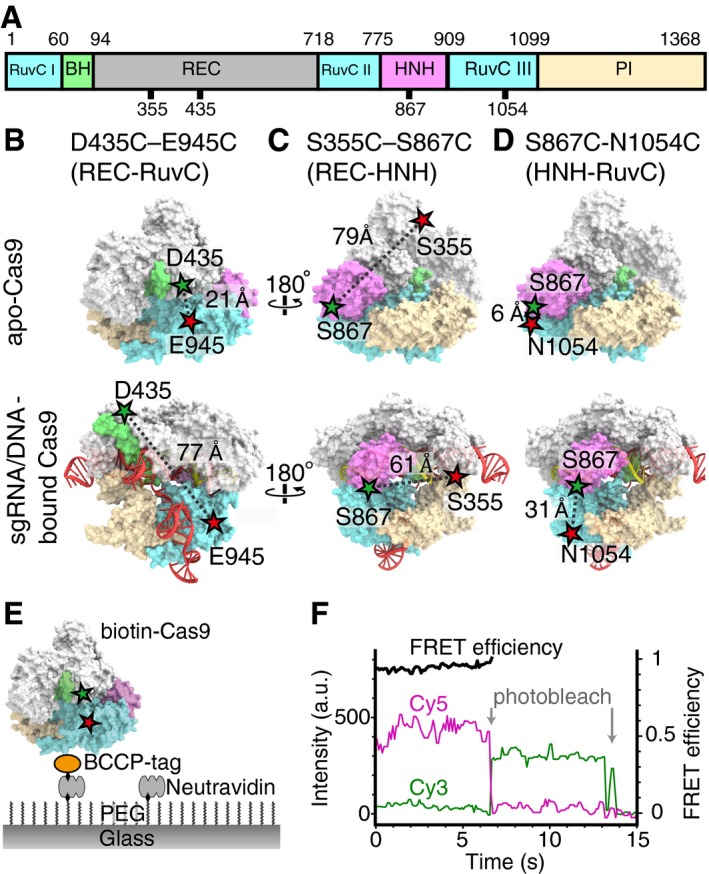
A
The domain diagram of Cas9. The numbers indicate the amino acids that were fluorescently labeled in this study.
-
B–D
Designs of the Cas9 constructs for smFRET measurements: D435C–E945C (B), S355C–S867C (C), and S867C‐N1054C (D). Crystal structures of apo‐Cas9 (PDB 4CMP) and the sgRNA/DNA‐Cas9 complex (PDB 4OO8). The REC lobe, the bridge helix, and the RuvC, HNH, and PI domains are colored gray, green, blue, pink, and light brown, respectively. The Cy3‐ and Cy5‐labeled amino acids are indicated by green and red stars.
-
E
Schematic drawing of the smFRET measurement system. Cas9, biotinylated via biotin carboxyl carrier protein (BCCP), was immobilized on a PEG (polyethylene glycol)‐ and biotin‐PEG‐coated glass surface, using the avidin–biotin system.
-
F
Time trajectories of smFRET efficiency of the D435C–E945C construct, labeled with Cy3 and Cy5. The green and magenta lines represent the fluorescence intensities of Cy3 and Cy5, respectively. The FRET efficiency (black lines) was calculated from the intensities of Cy3 and Cy5 before the photobleaching of either fluorochrome.