
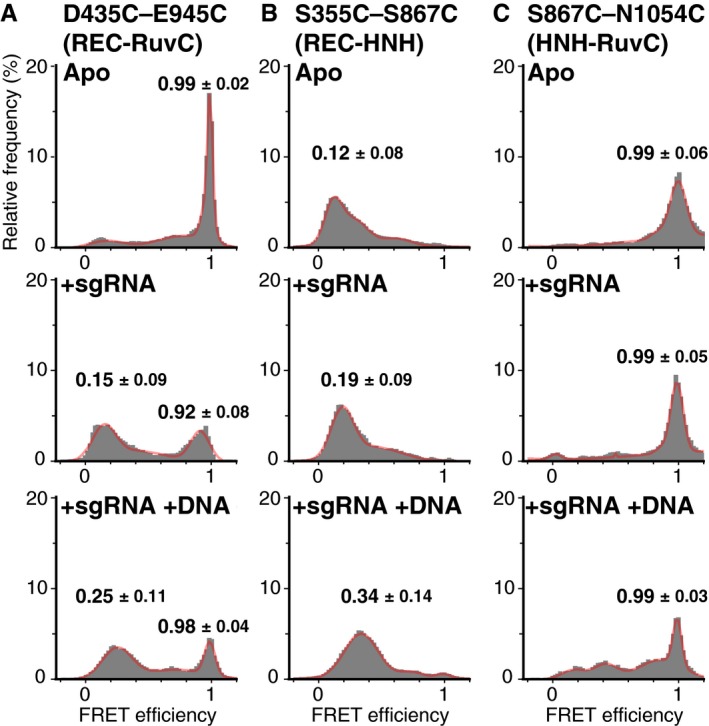
Figure 2. FRET efficiency histograms of all measured Cas9 molecules.
-
A–CFRET efficiency histograms of the D435C–E945C (left panels), S355C–S867C (center panels), and S867C‐N1054C (right panels) constructs. The histograms were generated from the time traces of the FRET efficiency in the absence of nucleic acids (A), in the presence of 200 nM sgRNA (B), and in the presence of 200 nM sgRNA and 200 nM target DNA (C). All of the experiments shown in this figure were performed in the presence of 2 mM MgCl2. The numbers of measured molecules are summarized in Table EV1. The histograms were fitted with multi‐peaks Gaussian curves (red). The peak values of the primary peaks of FRET efficiency are shown on the histograms (median ± HWHM).
Source data are available online for this figure.