
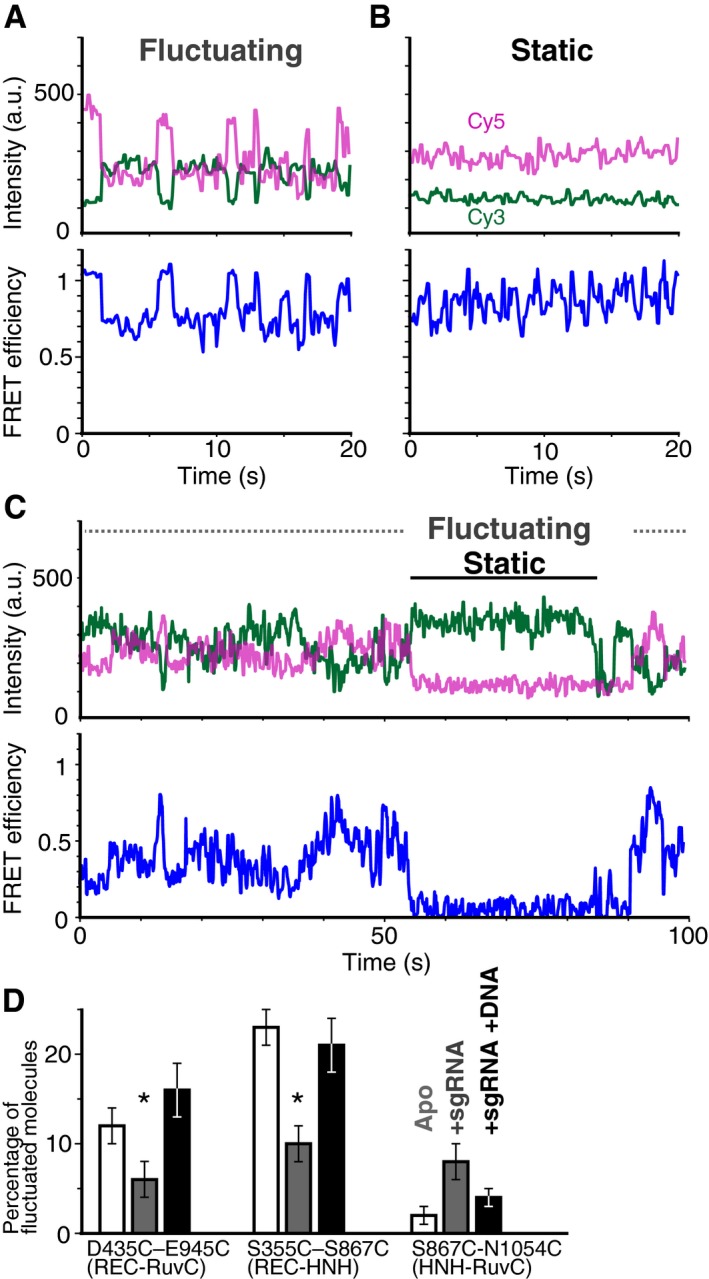
Figure 3. The binding of sgRNA and target DNA changes the flexibility of the Cas9 domains.
-
A, BRepresentative time trajectories of fluctuating (A) and static (B) D435C‐E945C molecules in the sgRNA/DNA‐bound ternary complex labeled with Cy3 and Cy5. The green and magenta lines represent the fluorescence intensities of Cy3 and Cy5, respectively (top trace). The FRET efficiencies (black lines) were calculated from the intensities of Cy3 and Cy5 (bottom trace).
-
CSome of the time trajectories of the fluorescence intensities (top trace) and the smFRET efficiency (bottom trace) show both fluctuating of and static phases.
-
DThe percentage of Cas9 molecules that showed fluctuations in FRET efficiency. The numbers of measured molecules are summarized in Table EV1. The bars from left to right represent the percentages in the absence of nucleic acid (white), in the presence of 200 nM sgRNA (gray), and in the presence of 200 nM sgRNA and 200 nM target DNA (black). Error bars show SEM. Each data set was collected from three repetitive experiments. Asterisks indicate the statistical differences (P < 0.05, Steel–Dwass test).
Source data are available online for this figure.