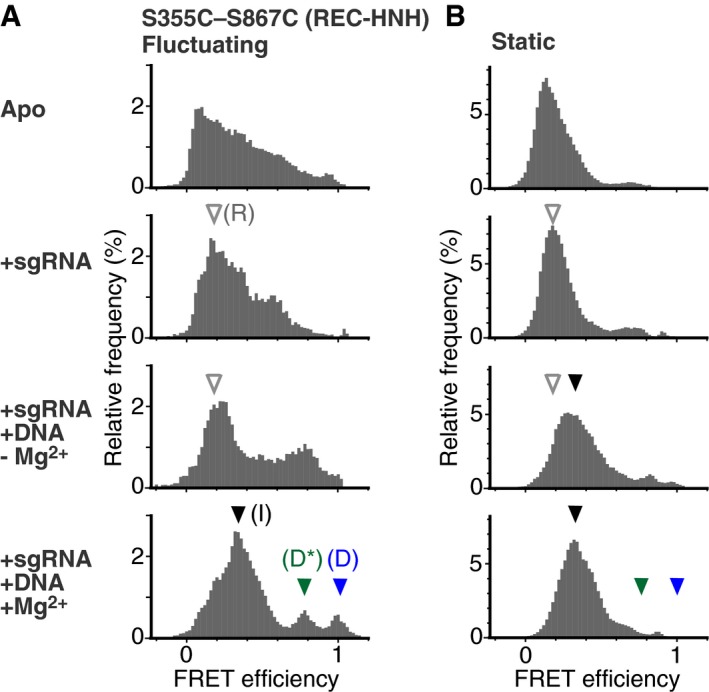
Figure 4. The HNH domain transiently exists at the cleavage‐competent D position during the flexible movement.

-
A, BFRET efficiency histograms of fluctuating (A) and static (B) S355C–S867C molecules. The histograms were generated from the time traces of the FRET efficiency. The numbers of measured molecules are summarized in Table EV1. The panels from top to bottom show data in the absence of nucleic acids, in the presence of 200 nM sgRNA, in the presence of 200 nM sgRNA and 200 nM target DNA without Mg2+, and in the presence of 200 nM sgRNA and 200 nM target DNA with Mg2+, respectively. In the presence of Mg2+, the fluctuating molecules exhibited three clear FRET efficiency peaks, corresponding to the three HNH positions relative to the REC lobe (A). According to the structural and functional data, we refer to the HNH positions corresponding to the ˜0.2 (white arrowhead), ˜0.4 (black arrowhead), ˜0.8 (green arrowhead), and ˜1.0 (blue arrowhead) FRET efficiencies as the R, I, D*, and D positions, respectively. The same FRET efficiencies are indicated by the arrowheads in the histograms of static molecules (B).
Source data are available online for this figure.
