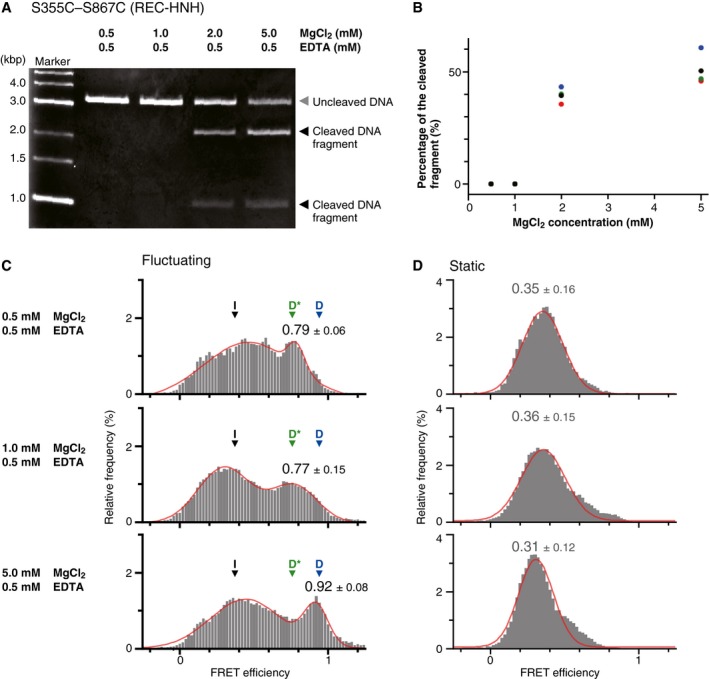
C, DFRET efficiency histograms of fluctuating (C) and static (D) S355C–S867C molecules. The panels from top to bottom show data in the presence of 0.5, 1, and 5 mM MgCl2. All of the assays were performed in the presence of 0.5 mM EDTA. The low, middle, and high FRET efficiencies corresponding the I, D*, and D positions of the HNH domain are indicated by black, green, and blue arrowheads, respectively (C). The numbers of observed molecules were 57, 72, and 40 for 0.5, 1, and 5 mM MgCl2 conditions in (C), and 57, 55, and 70 for those in (D), respectively. The number of peaks in the histograms was estimated to be two for the histograms in (C) and one for the histograms in (D), using Silverman's test (threshold: P = 0.01). Thus, we fitted the histograms with two‐peak (C) or one‐peak (D) Gaussian distribution function (red curves). The peak values and widths of the higher FRET peaks were indicated on the histograms (median ± HWHM). The DNA cleavage activity (A, B) correlated well with the appearance of the highest FRET efficiency peak (C), indicating that the HNH domain in the D position adopts the cleavage‐competent state.

