
Figure 5. Reversible transitions of the HNH positioning in the ternary complex.
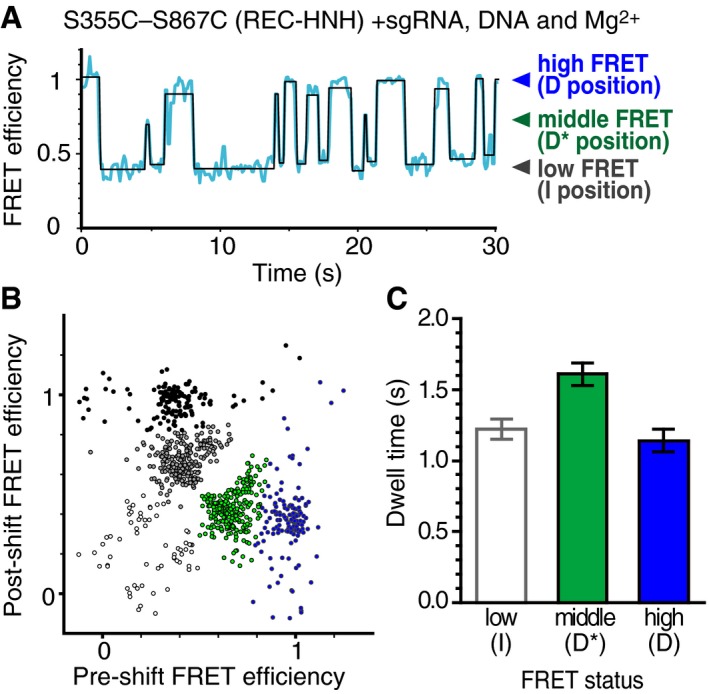
- Representative time trajectory of the FRET efficiency, showing the fluctuation of the HNH domain in the sgRNA/DNA‐bound S355C–S867C complex with Mg2+. The transition points of the FRET efficiency (blue line) were detected using the HMM algorithm (black line).
- The transition density plot of different FRET states of the sgRNA/DNA‐bound S355C–S867C complex with Mg2+. The density map was clustered into five groups (white, gray, black, green, and blue closed circles) based on the k‐means method with k = 5, suggesting that the HNH movement between the D* and D processes (middle and high FRET efficiencies) is rare.
- Bar plot of the dwell times for each transition. The mean dwell times were determined by fitting the dwell time distributions (n = 399, 223, and 136 for low, middle, and high FRET status, respectively) to a single exponential decay function (Appendix Fig S2). Error bars show SEM.
Source data are available online for this figure.