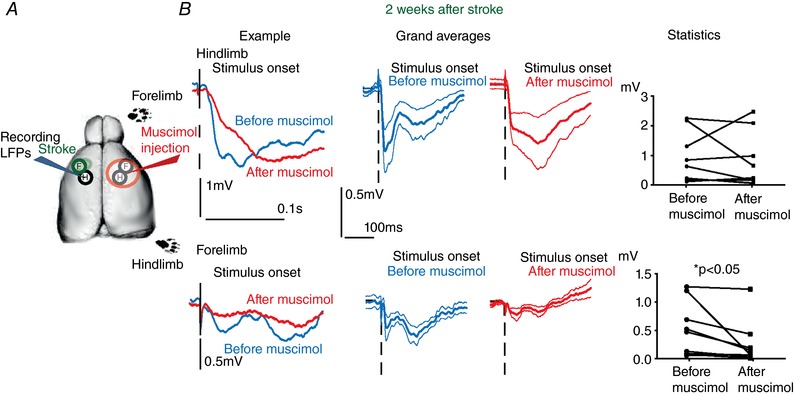
Figure 7. Loss of interhemispheric inhibition and selective facilitation of recovered responses of callosal origin in the stroke periphery.

A, experimental sketch for LFPs from hS1 before and after acute silencing of contralateral (contralesional) S1 with muscimol in the animals that displayed full recovery (2 weeks after stroke). B, loss of interhemispheric inhibition after recovery from stroke. Left: example of LFP responses to separate stimulation of the hindlimb (top) and of the forelimb (bottom) before (in blue) and after (in red) silencing contralateral S1. Note that the response to hindlimb did not show the dramatic increase of sensory responses observed in controls, whereas a reduction of the response to forelimb stimulation was observed. Middle: comparison of the grand averages of the LFP responses to hindlimb (top) and forelimb (bottom) before and after contralateral S1 silencing (blue and red, respectively). Mean ± SEM values are given. In this case, sensory responses to hindlimb stimulation were not significantly affected by contralateral S1 silencing (top), whereas the recovered forelimb responses were almost suppressed by the same manipulation. Right: paired statistical comparison of the amplitudes of the sensory responses to separate hindlimb (top) and forelimb (bottom) before and after contralateral S1 silencing. Note the lack of effect of contralateral S1 silencing for hindlimb responses after callosal silencing (top: Wilcoxon paired test, P = 0.3), whereas forelimb responses showed a significant decrease after the very same manipulation (Wilcoxon paired test, P = 0.01). [Color figure can be viewed at http://wileyonlinelibrary.com]
