Figure 4.

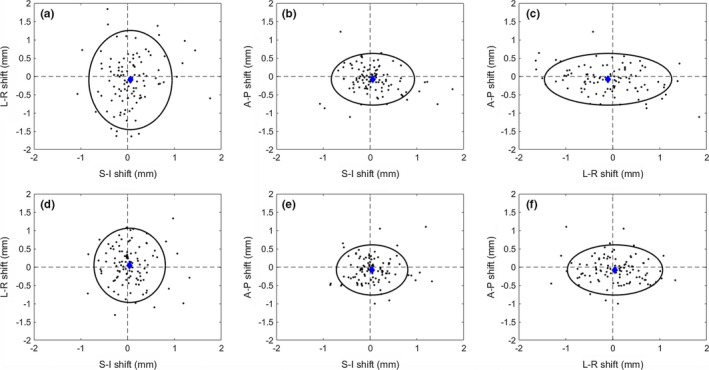
Shift 3D distribution. Calculated shifts for all 104 patients from the 1st mid‐treatment image (a‐c), and 2nd mid‐treatment image (d‐f). The mean (blue diamond), and 95% confidence region (black ellipse) are indicated.

Shift 3D distribution. Calculated shifts for all 104 patients from the 1st mid‐treatment image (a‐c), and 2nd mid‐treatment image (d‐f). The mean (blue diamond), and 95% confidence region (black ellipse) are indicated.