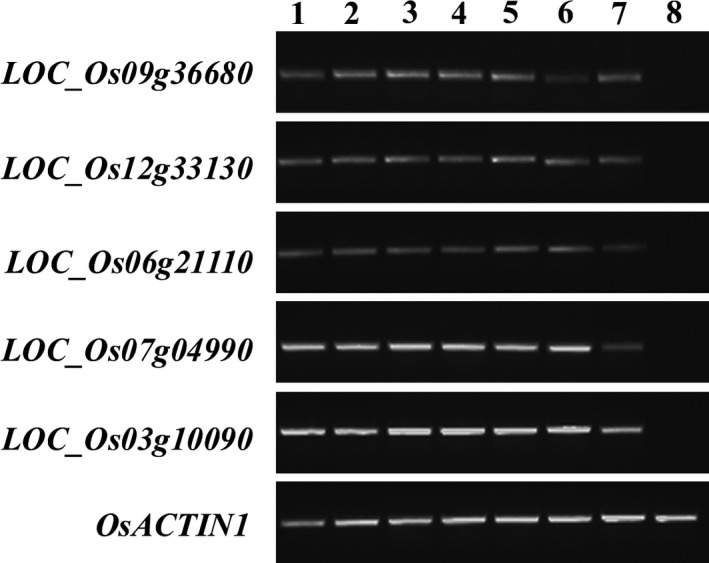
Figure 1.

Expression profile of five nonendosperm tissue‐expressed genes. The temporal and spatial expression patterns of five genes were examined by semi‐quantitative RT–PCR using 28‐cycle amplification in different tissues, including the roots (1) and leaves (2) of 10 DAG rice seedlings; the roots (3), leaves (4), stems (5) and sheaths (6) of 60 DAG plants; the panicles of 75 DAG plants (7) and the endosperm of maturing seeds collected at 21 DAF (8). OsACTIN1 were used to normalize the samples.
