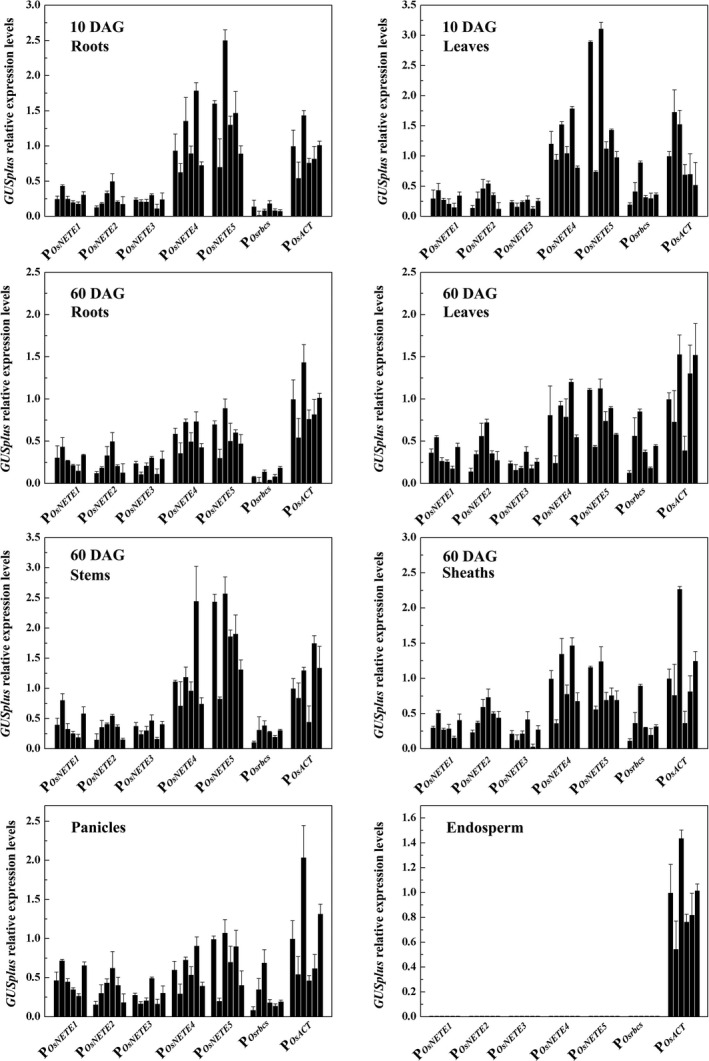
Figure 3.

qRT–PCR analysis of the reporter gene expression in six single‐copy transgenic lines harbouring promoter:: GUSplus. Total RNA was prepared from various tissues including the panicles of 75 DAG plants and the endosperm of maturing seeds (21 DAF). The relative levels of GUSplus were measured by qRT–PCR, and OsACTIN1 was used as the internal control gene. The levels of promoter‐driven reporter gene transcripts were calculated relative to those of GUSplus in the P O s ACT ::GUSplus transgenic lines. The average was calculated from three biological replicates. ±SD is indicated.
