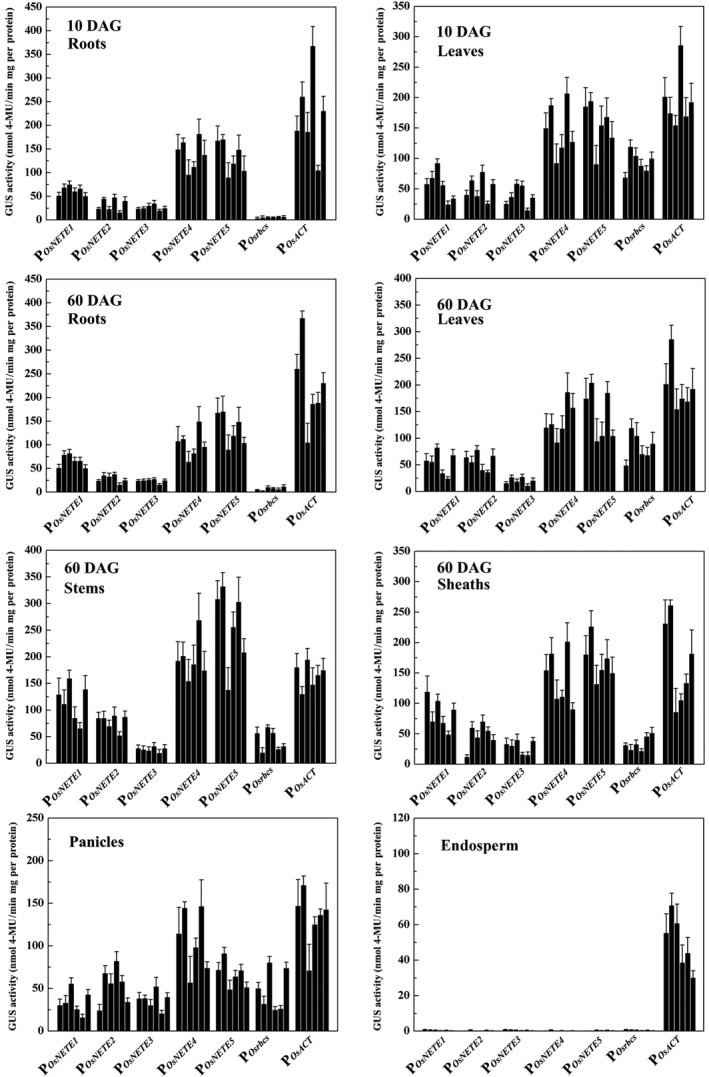
Figure 4.

Quantitative analysis of promoter activities in T3 lines harbouring promoter:: GUSplus. GUS activity was measured in the roots and leaves of 10 DAG seedlings; the roots, leaves, stems and sheaths of 60 DAG plants; the panicles of 75 DAG plants and the endosperm of mature seeds. Six independent single‐copy lines from each construct were analysed. GUS activity, given as nmol 4‐methylumbelliferone (MU) per minute per milligram protein, was averaged from three biological replicates. ±SD is indicated.
