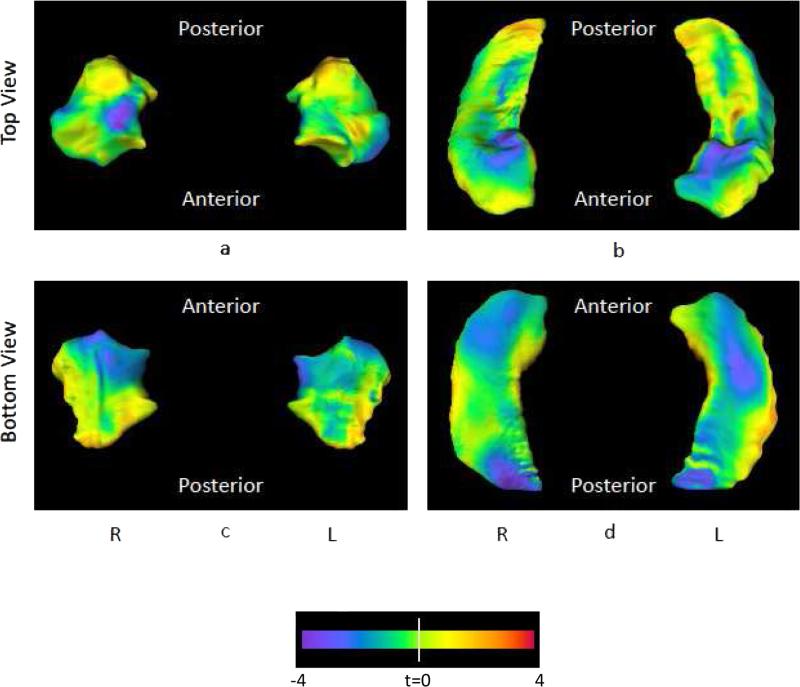
Figure 1.
Panel (a) shows the left and right amygdala from the top (dorsal surface), panel (c) shows the left and right amygdala from the bottom (ventral surface). Panel (b) shows the left and right hippocampus from the top (dorsal surface), and panel (d) shows the left and right hippocampus from the bottom (ventral surface). The flame coloring represents the difference between the mean surface of the IED subjects the mean surface of controls. Inward variation of the surface is represented by cooler colors (i.e., blue to purple), while outward variation is represented by warmer colors (i.e., orange to red). For the amygdala, areas showing the greatest inward deformities are concentrated in the superior and inferior aspects of the medial-anterior parts of the amygdala. For the hippocampus, areas showing the greatest inward deformities are concentrated in the superior and inferior aspects of the head as well as the inferior aspect of the tail.

