-
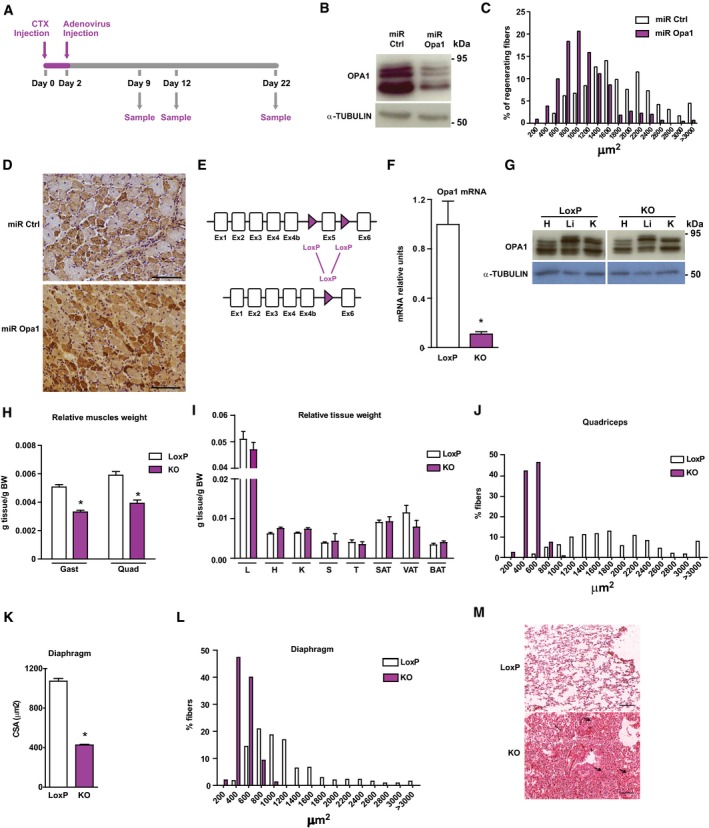
A
Scheme of the experimental design of CTX‐induced injury.
-
B
Opa1 protein levels in control C2C12 myoblasts, which were transduced with control miRNA (miR Ctrl) or in Opa1 loss‐of‐function C2C12 myoblasts, which were transduced with adenoviruses encoding for miRNA against Opa1 (miR Opa1) (n = 5).
-
C
Distribution of myofiber size in mice treated with miR Ctrl or miR Opa1 adenoviruses at dpi 12 (n = 5).
-
D
Representative image of dMHC immunohistochemistry from gastrocnemius muscle treated with miR Ctrl or miR Opa1 adenoviruses (12 dpi). Scale bars, 100 μm.
-
E
Partial genomic structure of the Opa1 gene showing the scission of exon 5, thus deleting all Opa1 protein isoforms.
-
F
Opa1 mRNA levels in the gastrocnemius muscle of loxP (non‐expressing Cre Opa1loxP/loxP mice) and skeletal muscle‐specific KO mice (KO) (n = 10).
-
G
Opa1 protein levels in tissue homogenates from control (loxP) and skeletal muscle‐specific KO mice (KO).
-
H, I
Relative weight of muscles (gastrocnemius (Gast) and quadriceps (Quad)) (panel H) (n = 18) and organs (liver (L), heart (H), kidney (K), spleen (S), T thymus (T), subcutaneous adipose tissue (SAT), visceral adipose tissue (VAT), and brown adipose tissue (BAT)) (panel I) (n = 32) of 9‐week‐old loxP and KO mice. These data are expressed as g of tissue/g of body weight (BW).
-
J
Distribution of myofiber size of 150 myofibers in quadriceps muscle.
-
K, L
Mean cross‐sectional area (CSA) (K) and distribution of myofiber size (L) of 150 myofibers in diaphragm muscle.
-
M
Representative images of hematoxylin and eosin‐stained lung sections from loxP and KO mice. Thick arrows indicate congestion and atelectasis. Thin arrows indicate normal parenchyma. Asterisks show bronchioles. Scale bars, 100 μm.
Data information: Data represent mean ± SEM. *
< 0.001 vs. control loxP mice. Data were analyzed using Student's
‐test.