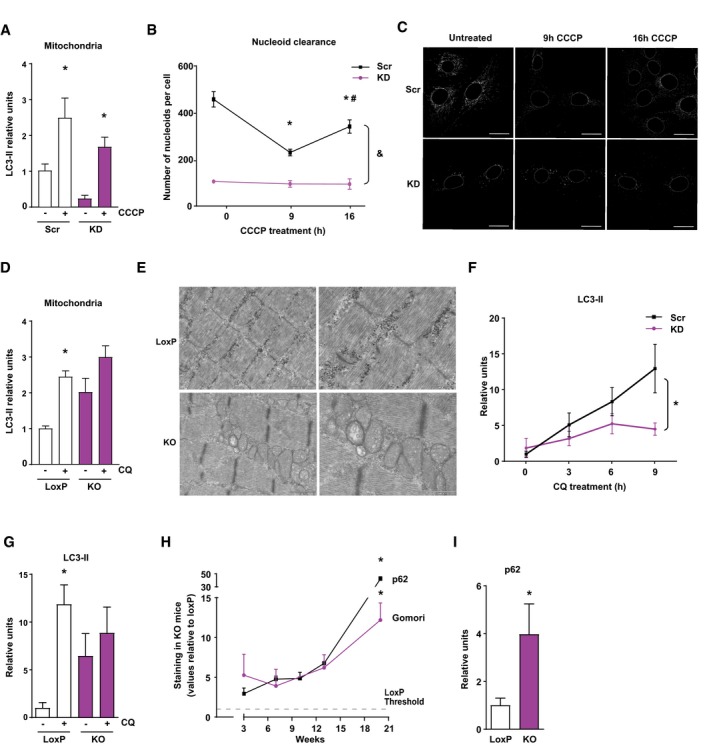
LC3‐II recruitment to mitochondrial enriched fractions in Scr and KD myoblasts after 30 min of CCCP treatment (n = 4).
Study of mitophagy completion by mtDNA nucleoid clearance upon long CCCP treatment in Scr and KD cells. Data represent mean ± SEM of three independent experiment with 20 cells randomly quantified per condition. *P < 0.05 vs. Scr untreated, #
P < 0.05 vs. 9 h of treatment, and &
P < 0.05 KD vs. Scr.
Representative images of the nucleoid clearance upon CCCP treatment. Scale bars 20 μm.
Relative LC3‐II protein levels in mitochondrial enriched fractions of quadriceps muscle after 5 days of intraperitoneal treatment with chloroquine (CQ) (10 observations per group).
Electron micrographs of gastrocnemius muscles from 3‐week‐old loxP and KO mice. Scale bars, 1 μm in left panels, and 500 nm in right panels.
Time‐course study of LC3‐II protein levels in Scr and KD C2C12 myoblasts under CQ treatment (n = 6).
Relative LC3‐II protein levels in total homogenates of gastrocnemius muscle after 5 days of intraperitoneal treatment with CQ (six observations per group).
Quantification of p62 expression and Gomori's Trichrome staining in gastrocnemius muscle of Opa1 KO animals at 3, 7, 10, 13, and 20 weeks of age. Values of Opa1 KO mice are represented relative to the loxP group. This quantification was performed using Trainable Weka Segmentation plugin from ImageJ (five images per group).
Relative expression of 3‐week‐old mice of p62 (seven and four observations in control and KO mice, respectively).
Data information: Data represent mean ± SEM. *
< 0.05 vs. control group. Data were analyzed using Student's
test (B, F, and H).