
Table 3.
Summary of Differences in Features Derived from Time Traces of the Hemodynamic Responses, SHb(t) (Percentage Change in Deoxyhemoglobin Signal), between Baseline and 2 Weeks after the Initial Treatment with Taxane
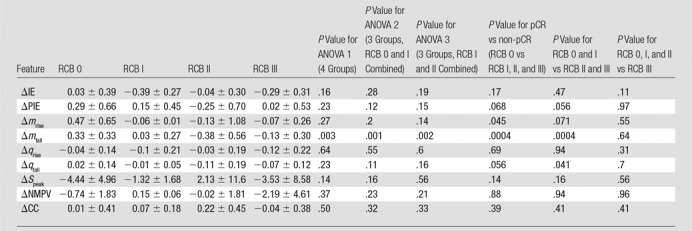
Note.—Unless otherwise specified, data are means ± standard deviations. ANOVA = analysis of variance, ΔCC = change in correlation coefficient, ΔIE = change in initial enhancement, Δmfall = change in fall slope, Δmrise = change in rise slope, ΔNMPV = change in normalized maximum peak value, ΔPIE = change in postinitial enhancement, Δqfall = change in washout rate, Δqrise = change in rise rate, ΔSpeak = change in peak signal, pCR = pathologic complete response, RCB = residual cancer burden.