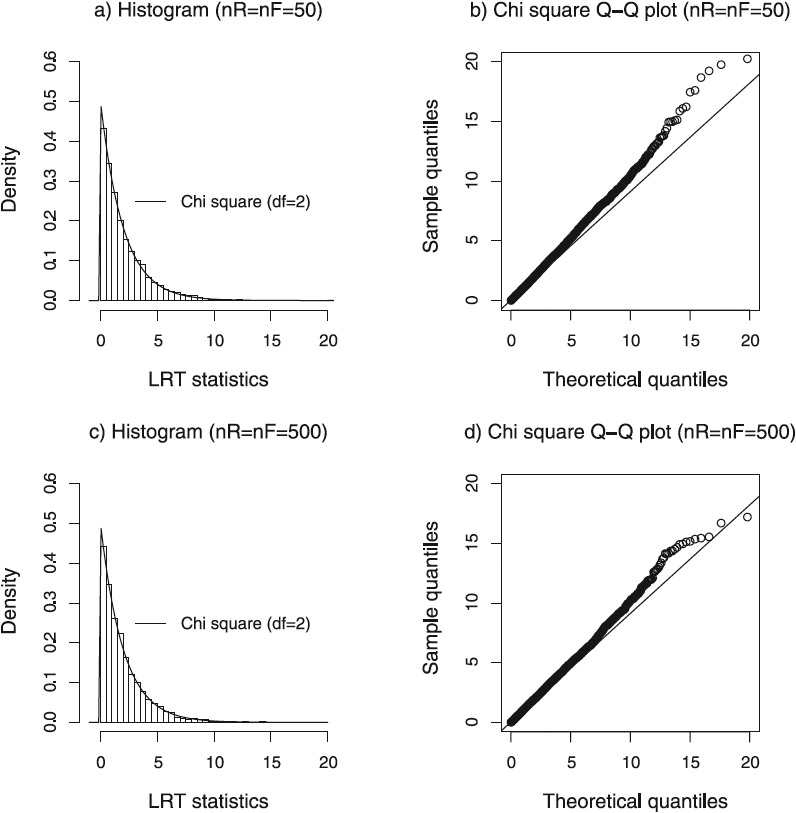
Figure 1.

Histograms and chi-square Quantile-Quantile (Q-Q) plots.
Note. These histograms and chi-square Q-Q plots for = = 50 and = = 500 are presented to demonstrate the discrepancy between theoretical chi-square distributions with the degrees of freedom of 2 and empirical bootstrap sampling distributions. The histograms of the LRT statistics calculated from the 10,000 bootstrap samples appear to match well with the theoretical chi-square distributions represented by solid lines in figures. However, chi-square Q-Q plots show that, when the theoretical quantiles are large, sample quantiles are slightly greater than the theoretical quantiles, which suggests that the empirical bootstrap sampling distributions have slightly thicker right tails compared with the theoretical chi-square distributions. LRT = likelihood ratio test.
