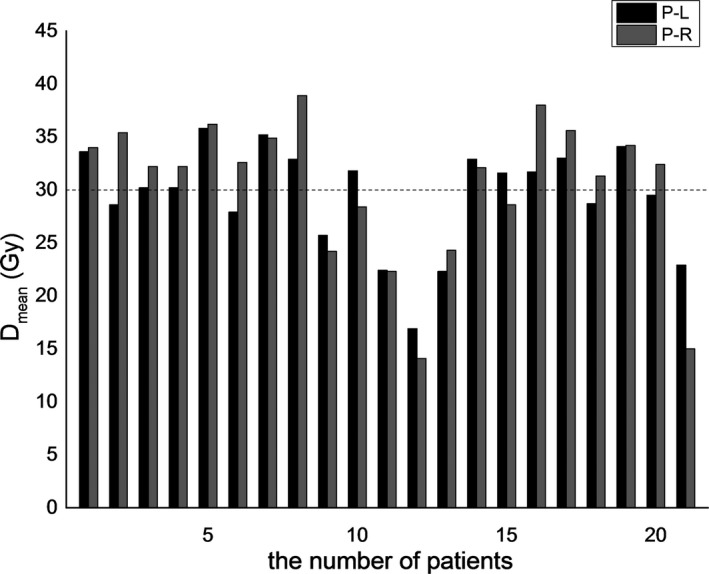
Figure 7.

Delivered parotid gland Dmean for 21 patients. Herein, P‐L represents the left parotid gland, and R‐L represents the right parotid gland. No. 1 to No. 8 patients developed xerostomia, and the remaining 13 did not. The dotted line along 30 Gy represents the tolerance of the parotid gland.
