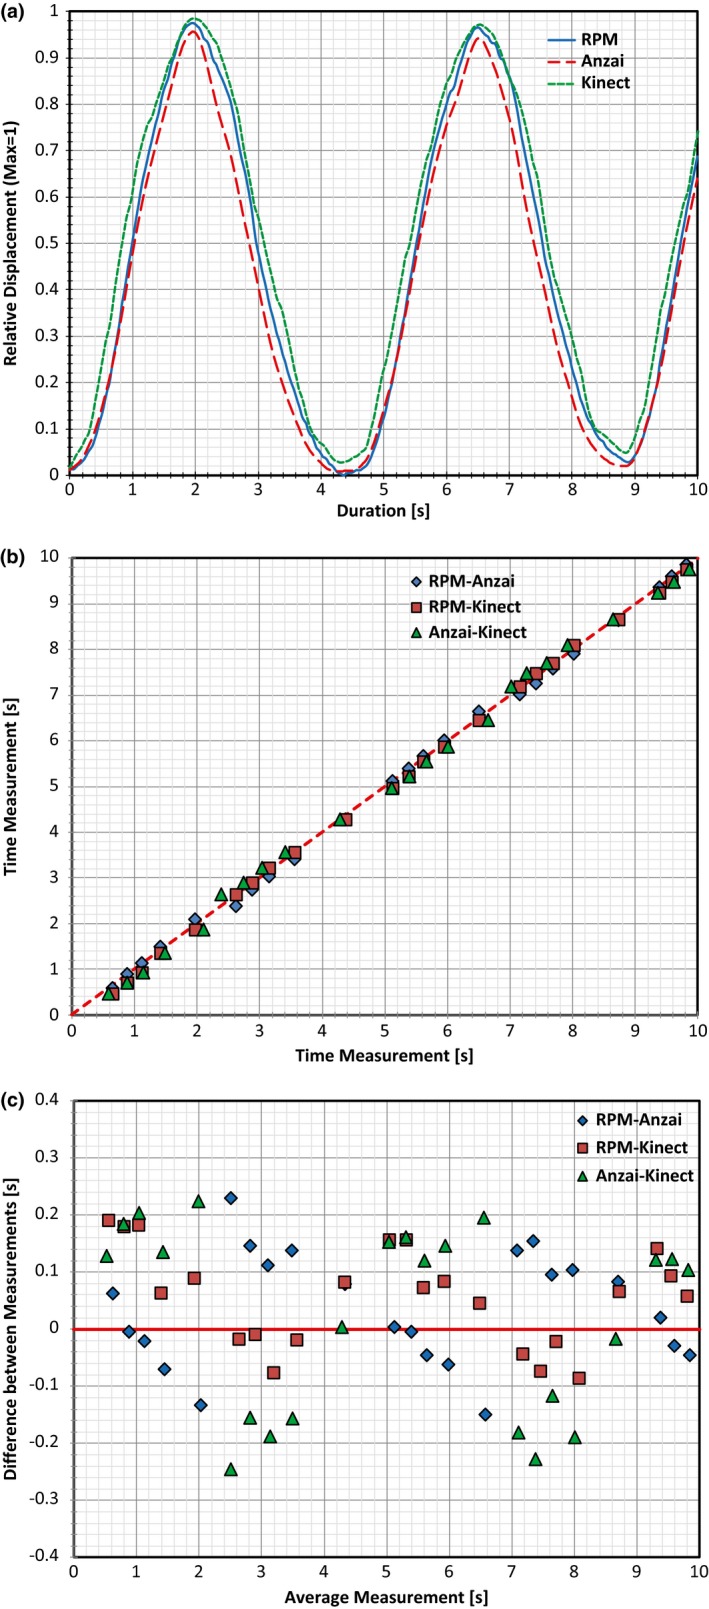
Figure 2.

Plots created for Subject 1 based on two full respiratory cycles. (a) Plot with all three traces overlapped, (b) plot of time measurement vs time measurement obtained for the amplitude binning process for all three products comparisons, (c) Bland–Altman plot generated using the same measured values plotted in (b).
