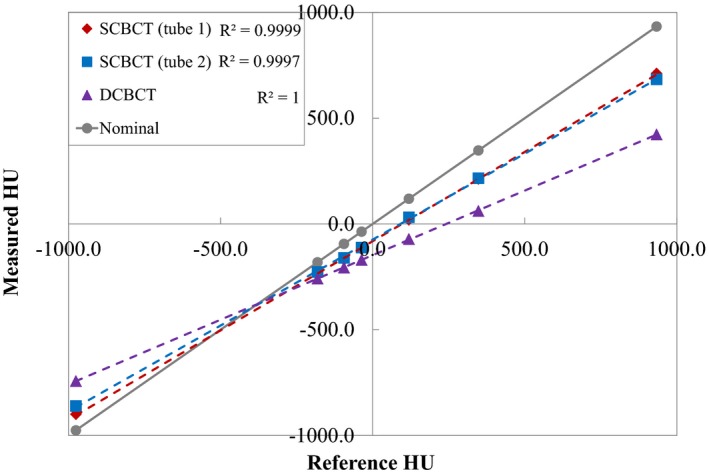
Figure 5.

Reference HU values as a function of measured HU values using SCBCT and DCBCT. Dashed lines are linear regression fits of the data and R 2 is the coefficient of determination. The solid gray line indicates where the reconstructed HU is equal to the reference HU.
