FIGURE 1.

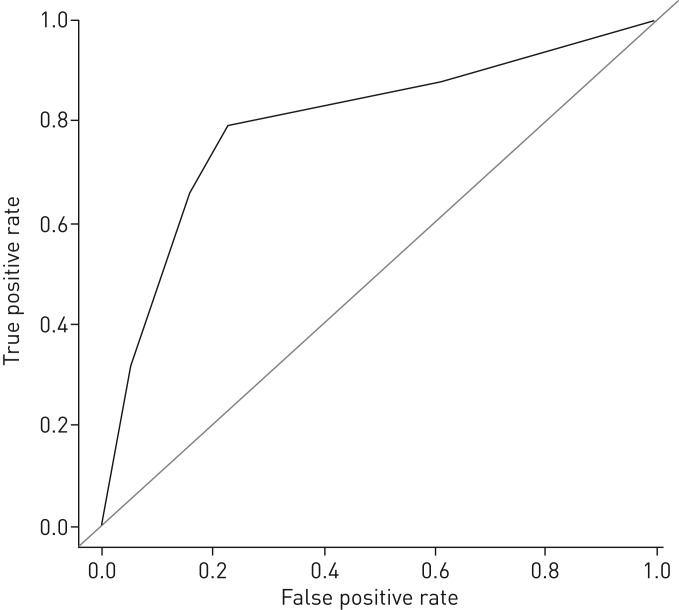
Receiver operating characteristic (ROC) curve of the low-dose computed tomography (LDCT) scan probabilities of a diagnosis of pneumonia compared with the reference diagnosis (area under the curve (AUC) 0.79 (95% CI 0.73–0.86)).

Receiver operating characteristic (ROC) curve of the low-dose computed tomography (LDCT) scan probabilities of a diagnosis of pneumonia compared with the reference diagnosis (area under the curve (AUC) 0.79 (95% CI 0.73–0.86)).