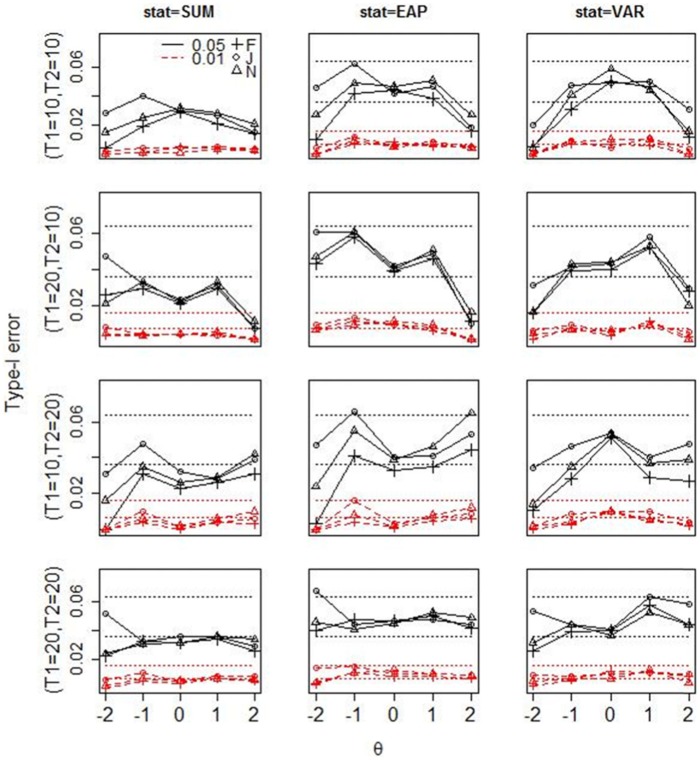
Figure 2.
Type I error for each test statistic under three estimation methods (F = fiducial, J = Jeffreys, N = N(0, )) in all simulation conditions.
Note. The first to third columns show the Type I error for the summed score, EAP, and posterior variance, respectively. Each row shows the Type I error under a given length of T1 and T2. The broken lines in each plot show the empirical Type I error at the nominal level of 0.01, and the solid lines show the empirical Type I error at the nominal level of 0.05. The two parallel dotted lines represent the 95% normal-approximation confidence interval for nominal level of 0.01/0.05, respectively. SUM = summed score; EAP = expected a posterior; VAR = posterior variance.

