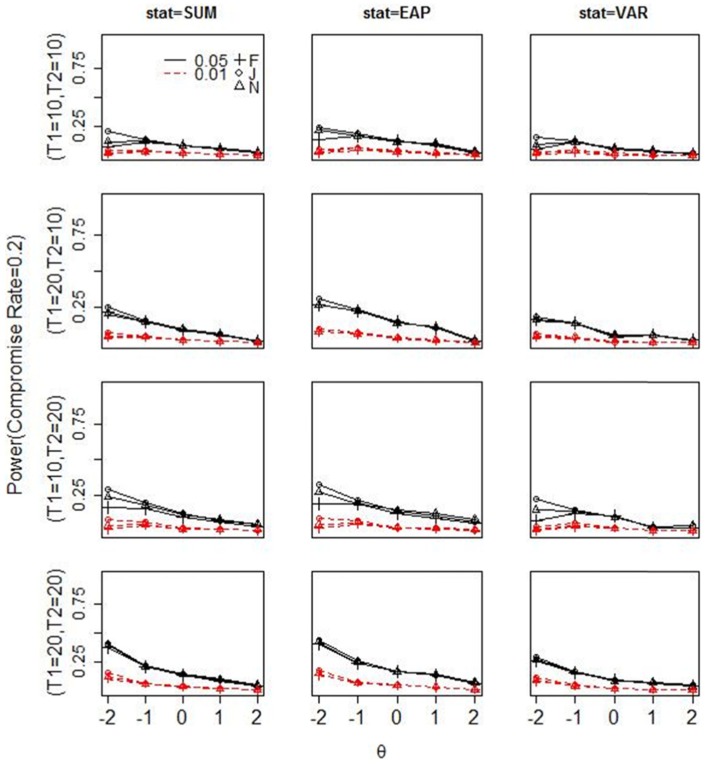
Figure 3.
Power for each test statistic under three estimation methods (F = fiducial, J = Jeffreys, N = N(0, )) with 20% truly compromised items in T2.
Note. The first to third columns show the power for the summed score, EAP, and posterior variance, respectively. Each row shows the power under a given length of T1 and T2. The broken lines in each plot show the power at the nominal level of 0.01, and the solid lines show the power at the nominal level of 0.05. SUM = summed score; EAP = expected a posterior; VAR = posterior variance.

