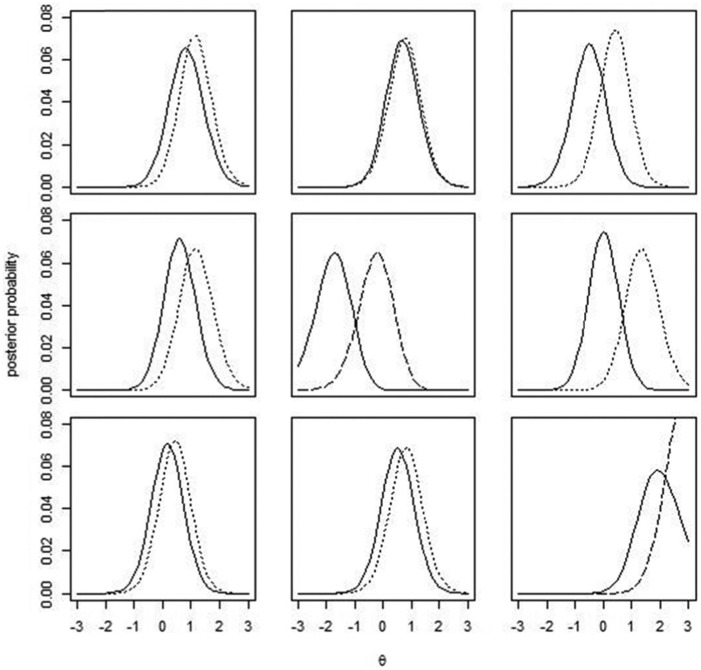
Figure 7.
Examples detected by the posterior variance among modified examinees.
Note. The solid line represents posterior distribution of θ on T1, and the broken or dotted lines represent θ posterior distributions on T2. The broken lines indicate that the observed posterior variance is at the right tail of the predictive distribution, and dotted lines indicate that the observed posterior variance is at the left tail.

