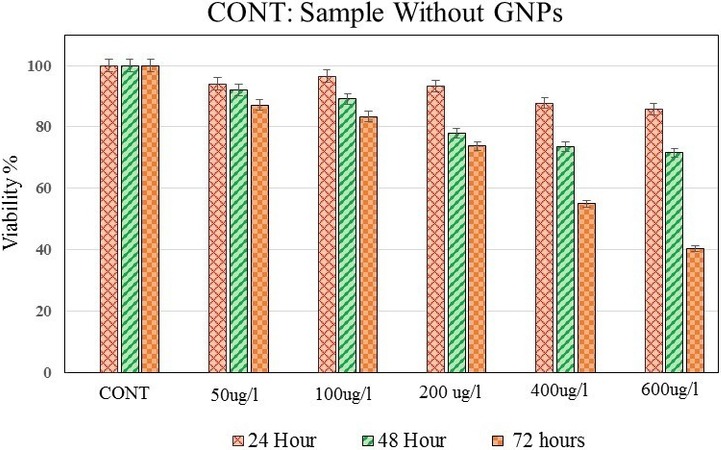
Figure 5.

Viability comparison of melanoma cells exposed to different concentrations of GNPs as an indicator of GNPs toxicity in human eye melanoma cells. Cell viability was measured by the MTT assay test. Viability was calculated as the percentage of the viable cells compared to the untreated controls (CONT). The error bars represent the standard deviation of the mean of three replicates.
