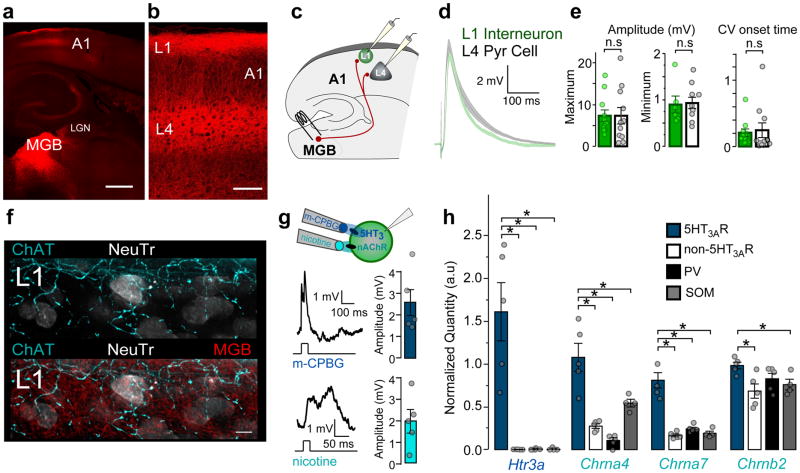
Figure 1. MGB and neuromodulatory inputs converge onto superficial 5-HT3AR interneurons.
(a,b) Projections from the medial geniculate body (MGB; red) to layers (L1) 1 and 4 of primary auditory cortex (A1). Scale bars = 500 μm, 100 μm. Representative image from one of 4 mice. (c) 5-HT3AR cells receive direct MGB inputs. Schematic illustrating recording configuration. (d) Mean (± SEM, shaded region) EPSPs recorded in all L1 interneurons (green) and L4 pyramidal cells (gray) in response to electrical MGB fiber stimulation (L1, n = 11 cells/4 mice, L4, n = 11 cells/4 mice). (e) Left; Mean (± SEM) EPSP amplitudes evoked by maximal and minimal MGB fiber stimulation (EPSP maximum amplitude (mV): L1 = 6.91 ± 1.14, n = 11 cells/4 mice; L4 = 7.33 ± 1.96, n = 11 cells/4 mice; unpaired t test, two-tailed, t(20) = 0.19, P = 0.854; EPSP minimum amplitude (mV): L1 = 0.90 ± 0.18, n = 6 cells/4 mice; L4 = 0.94 ± 0.12, n = 10 cells/4 mice; Mann-Whitney U test, two-tailed, z = −0.27, P = 0.786). Right; Mean (± SEM) coefficient of variation (CV) of EPSP onset time (CV: L1 = 0.20 ± 0.06, n = 11 cells/4 mice; L4 = 0.25 ± 0.11, n = 11 cells/4 mice; Mann-Whitney U test, two-tailed z = −1.18, P = 0.237). (f) ChAT-expressing (cyan) and MGB axons (red) target L1 cells in A1 identified with Neurotrace (NeuTr, white). Scale bar = 5 μm. Representative image from one of 4 mice. (g) 5-HT3AR interneurons are depolarized by ionotropic 5-HT3 and nicotinic acetylcholine receptors (nAChRs). Left; Representative EPSPs evoked by focal application of nicotine or m-CPBG (100μM) recorded in 5-HT3AR cells within L1 of A1. Right; Mean (± SEM) EPSP amplitudes (m-CPBG, 2.56 ± 0.64 mV, n = 5 cells/2 mice; nicotine, 1.99 ± 0.54 mV, n = 5 cells/2 mice). (h) Expression of Htr3a, Chrna4, Chrna7, and Chrnb2 encoding 5-HT3AR and nAChR subunits (α7, α4, and β2) measured within cortical interneuron subtypes using fluorescent-activated cell sorting (FACS) or A1 cells not expressing GFP after sorting 5-HT3AR cells. (Normalized quantity Htr3a: 5-HT3AR = 1.61 ± 0.34; non-5-HT3AR = 0.002 ± 0.0007; PV = 0.005 ± 0.004; SST = 0.007 ± 0.007; Kruskal-Wallis, χ2(3) = 11.29, P = 0.010, compared to 5-HT3AR using Steel test, non-5-HT3AR, P = 0.033; PV, P = 0.033; SST, P = 0.048; Normalized quantity Chrna4: 5-HT3AR = 1.08 ± 0.16; non-5-HT3AR = 0.27 ± 0.03; PV = 0.10 ± 0.03; SST = 0.54 ± 0.05; one-way ANOVA, F(3,15) = 22.95, P < 0.0001, compared to 5-HT3AR using Dunnett’s test, non-5-HT3AR, P < 0.0001; PV, P < 0.0001; SST, P = 0.003; Normalized quantity Chrna7: 5-HT3AR = 0.81 ± 0.09; non-5-HT3AR = 0.17 ± 0.02; PV = 0.24 ± 0.02; SST = 0.19 ± 0.02; one-way ANOVA, F(3,15) = 38.98, P < 0.0001, compared to 5-HT3AR using Dunnett’s test, non-5-HT3AR, P < 0.0001; PV, P < 0.0001; SST, P < 0.0001; Normalized quantity Chrnb2: 5-HT3AR = 0.98 ± 0.04; non-5-HT3AR = 0.68 ± 0.08; PV = 0.83 ± 0.06; SST = 0.76 ± 0.06; one-way ANOVA, F(3,15) = 4.01, P = 0.028, compared to 5-HT3AR using Dunnett’s test, non-5-HT3AR, P = 0.012; PV, P = 0.238, SST, P = 0.081). n.s., P > 0.05, *P < 0.05.

