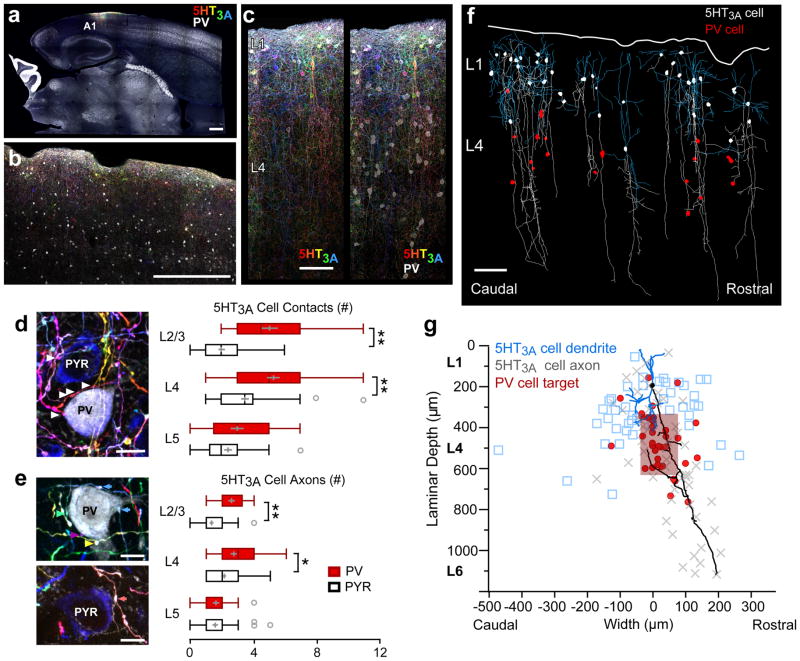
Figure 2. 5-HT3AR interneurons target intracolumnar PV interneurons within L4.
(a,b,c) Brainbow-expressing 5-HT3AR and PV interneurons (white) in primary auditory cortex (A1) within a thalamocortical slice. Scale bars = 500 μm, 500 μm, 50 μm. Representative images from one of 4 mice. (d) Left; Brainbow-expressing 5-HT3AR cell axons form numerous putative contacts onto a PV-expressing (white) cell soma, but only sparsely contact a pyramidal cell soma (PYR; blue) in L4 of A1. Representative image from one of 4 mice. Scale bar = 10 μm. Right; Number of 5-HT3AR cell puncta forming putative contacts onto PV and pyramidal cell somata (L2/3: PV = 5.05 ± 0.54, n = 22 cells/4 mice; PYR = 2.00 ± 0.20, n = 53 cells/4 mice; unpaired t test, two-tailed, t(27) = −5.31, P < 0.001; L4: PV = 5.30 ± 0.40, n = 43 cells/4 mice; PYR = 3.50 ± 0.24, n = 62 cells/4 mice; unpaired t test, two-tailed, t(72) = −3.84, P = 0.0003; L5: PV = 3.00 ± 0.41, n = 21 cells/4 mice; PYR = 2.43 ± 0.24, n = 44 cells/4 mice; unpaired t test, two-tailed, t(63) = −1.25, P = 0.216). (e) More 5-HT3AR cell axons target PV cell somata than pyramidal cell somata in cortical L2/3/4. Left; Unique Brainbow-expressing 5-HT3AR-cell axons forming putative contacts (colored arrows) onto target cells can be distinguished by Brainbow-color. Representative image from one of 4 mice. Scale bars = 10 μm. Right; Number of 5-HT3AR cell axons contacting PV and pyramidal cell somata (L2/3: PV = 2.59 ± 0.20, n = 22 cells/4 mice; PYR = 1.34 ± 0.12, n = 53 cells/4 mice; unpaired t test, two-tailed, t(73) = −5.39, P < 0.001; L4: PV = 2.72 ± 0.20, n = 43 cells/4 mice; PYR = 2.13 ± 0.12, n = 62 cells/4 mice; unpaired t test, two-tailed, t(73) = −2.54, P = 0.013; L5: PV = 1.62 ± 0.20, n = 21 cells/4 mice; PYR = 1.57 ± 0.17, n = 44 cells/4 mice; unpaired t test, two-tailed, t(63) = −0.18, P = 0.858). Box plots show median, lower and upper quartiles (boxes), minima and maxima, and outliers (circles). Mean ± SEM shown in gray. (f) 5-HT3AR-expressing cell axons (white) descend to contact PV cell somata (red) in L4 of A1. 5-HT3AR cell dendrites are shown in blue. Representative image from one of 2 mice. Scale bar = 100 μm. (g) Maximal laminar depth and rostro-caudal width of all 5-HT3AR cell (n = 54 cells/2 mice) dendrites (blue), axons (gray), and somatic innervation of PV cells (red; n = 36 cells/2 mice). Red box shows mean ± SD of PV cell innervation. Background illustrates representative reconstructed 5-HT3AR cell soma (black), axon (black), and dendrites (blue). *P < 0.05, **P < 0.001.

