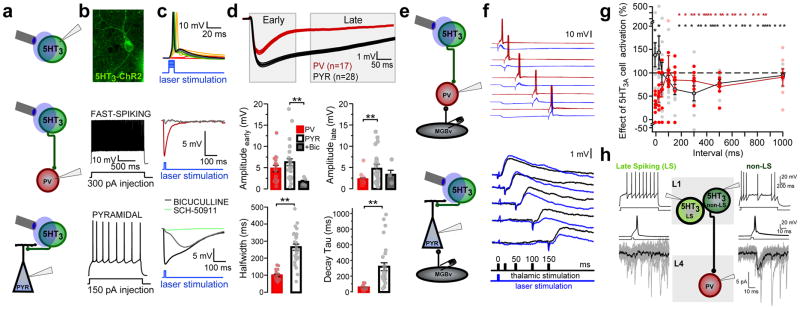
Figure 3. 5HT3AR interneurons gate a window of disinhibition by differentially targeting PV and pyramidal cells.
(a) Schematic of recording configurations. (b) 5HT3AR-ChR2 expressing cell in L1 from A1 (top). Spiking responses to intracellular current injection in fast-spiking (middle) and pyramidal (bottom) cells. (c) Spiking responses of 5HT3AR cell to increasing laser light (top; representative recording from one of 10 cells). 5HT3AR cell-evoked IPSPs recorded in PV (middle; representative recording from one of 17 cells) and pyramidal cells (bottom; representative recording from one of 28 cells). IPSPs are shown in the presence of bath-applied bicuculline (5μM; gray; representative recording from one of 5 cells) and SCH-50911 (10μM; green; representative recording from one of 4 cells). (d) Top; Averaged (±SEM, shaded region) IPSPs recorded in all PV (red) and pyramidal cells (black). Middle; Mean (±SEM) peak amplitude of early (0–150 ms) and late (200–600 ms) IPSP components (early amplitude (mV): PV = 4.80 ± 0.77, n = 17 cells/12 mice; PYR = 6.29 ± 0.78, n = 28 cells/16 mice, BIC = 1.69 ± 0.38; n = 5 cells/4 mice; Kruskal-Wallis, χ2(2) = 8.64, P = 0.013, compared to PYR using Steel’s test, PV, P = 0.470, BIC, P = 0.009; late amplitude (mV): PV = 1.98 ± 0.33; PYR = 4.84 ± 0.66; BIC = 3.02 ± 1.07; Kruskal-Wallis, χ2(2) = 12.16, P = 0.002, compared to PYR using Steel’s test, PV, P = 0.001, BIC, P = 0.277). Bottom; Mean (±SEM) IPSP half-width and decay τ (IPSP half-width (ms): PV = 99.51 ± 7.65, n = 17 cells/12 mice; PYR = 264.33 ± 18.15, n = 28 cells/16 mice; unpaired t test, two-tailed, t(36) = 8.37, P < 0.0001; IPSP decay τ (ms): PV = 58.56 ± 7.02, n = 17 cells/12 mice; PYR = 321.34 ± 50.06, n = 28 cells/16 mice; Mann-Whitney U test, two-tailed, z = −4.74, P < 0.0001). (e) Schematic of recording configurations. Optogenetic activation of 5-HT3AR cells followed by MGB electrical stimulation at varying intervals. (f) Top; Example PV cell recording shows that 5-HT3AR cell activation suppresses MGB-evoked spiking responses. Bottom; Example pyramidal cell recording shows that 5-HT3AR cell activation enhances MGB-evoked EPSPs for a brief time window before suppressing these responses. (g) Mean (± SEM) effects of 5-HT3AR cell activation on spiking responses in PV cells (red) and EPSPs in pyramidal cells (black) at varying intervals between 5-HT3AR cell activation and MGB stimulation (PV cell, n = 7 cells/5 mice; PYR cell, n = 12 cells/9 mice). (h) Single action potentials in a non-late-spiking (non-LS; right), but not LS (left), L1 interneuron produced reliable IPSCs in a PV interneuron in L4. (LS, recording from one of 2 paired connections; non-LS, recording from one of 8 paired connections). **P < 0.01.

