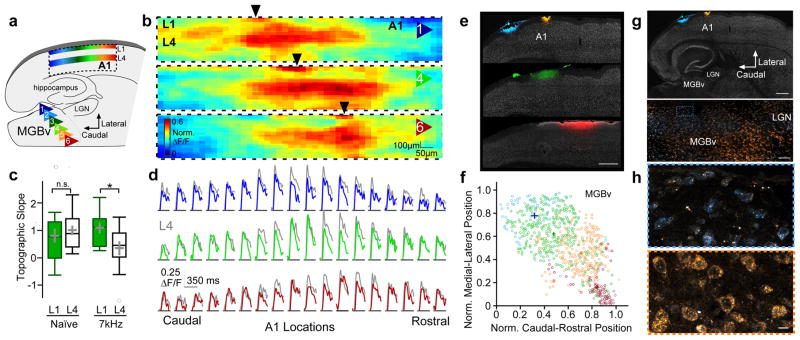
Figure 7. A cortical L1 map tunes auditory cortex.
(a) Schematic illustrating a topographic map of MGBv inputs to cortical L1 that mirrors L4. (b) Mean peak responses (norm. ΔF/F) across A1 to stimulation of MGBv positions 1, 4, and 6 across all animals using VSDI (n = 15 mice). Black arrows indicate the rostro-caudal location of peak responses within L1. (c) Topographic slopes within L1 and L4 of naïve mice and those exposed to 7kHz during the critical period (Naïve: L1 = 0.81 ± 0.26, n = 15 mice; L4 = 1.01 ± 0.17, n = 15 mice; unpaired t test, two-tailed, t(28) = 0.642, P = 0.526; 7kHz: L1 = 1.09 ± 0.20, n = 11 mice; L4 = 0.35 ± 0.26, n = 11 mice; unpaired t test, two-tailed, t(20) = −2.29, P = 0.033). Box plots show median, lower and upper quartiles (boxes), minima and maxima, and outliers (circles). Mean ± SEM shown in gray. (d) Average normalized traces (ΔF/F) across A1 locations (n = 15 mice) to stimulation of MGBv positions 1, 4, and 6 in L1 (colored) and L4 (gray). (e) Topographic projections from MGBv to L1. Focal injections of fluorescent dyes conjugated to wheat germ agglutinin (WGA) along the rostral-caudal axis within L1 of A1 from 3 mice. Scale bar = 500 μm (f) Scatter plot showing normalized position of all MGBv cells containing dye-labeled vesicles from 4 injections in 3 mice (colors indicate injections shown in e). Crosses show mean (± SEM) caudal-rostral and medial-lateral positions. (g) Thalamocortical slice of mouse injected with WGA in rostral and caudal sites within L1 of A1. Scale bars = 500 μm, 100 μm. (h) Dye-labeled vesicles in caudolateral (top; blue) and rostromedial (bottom; orange) MGBv locations from caudal and rostral A1 injections, respectively. Scale bar = 10 μm. n.s., P > 0.05, *P < 0.05.

