
Fig. 5.
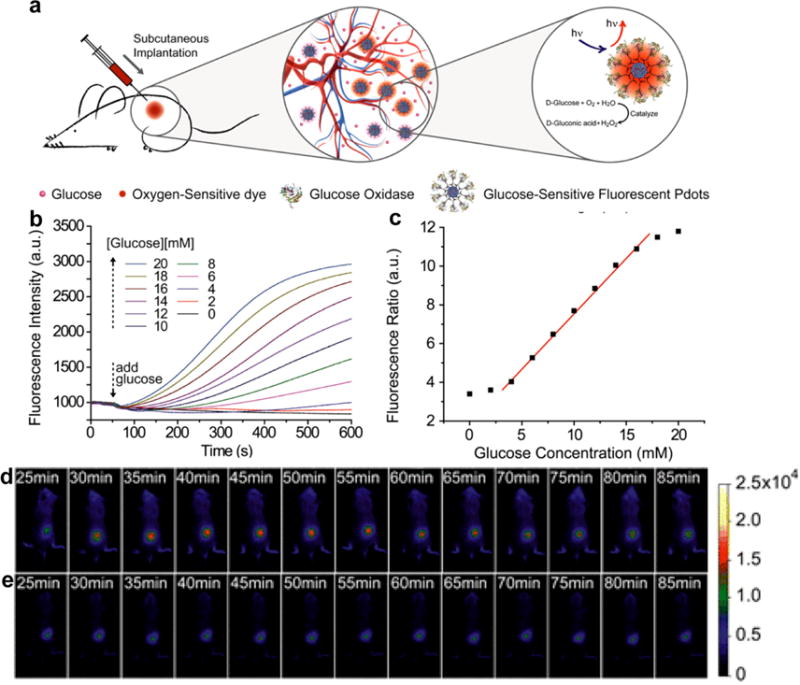
(a) Schematic illustration the in vivo glucose monitoring by using SPN13. (b) Response curves of SPN13 to glucose in aqueous suspensions. (c) Ratiometric calibration plot (I648/I428) of SPN13 sensor as a function of glucose concentration. In vivo fluorescence imaging of SPN13 injected living mouse with (d) and without (e) administration of glucose and insulin. Reprinted with permission from Ref. [89], copyright 2016, American Chemical Society.