Figure 4.

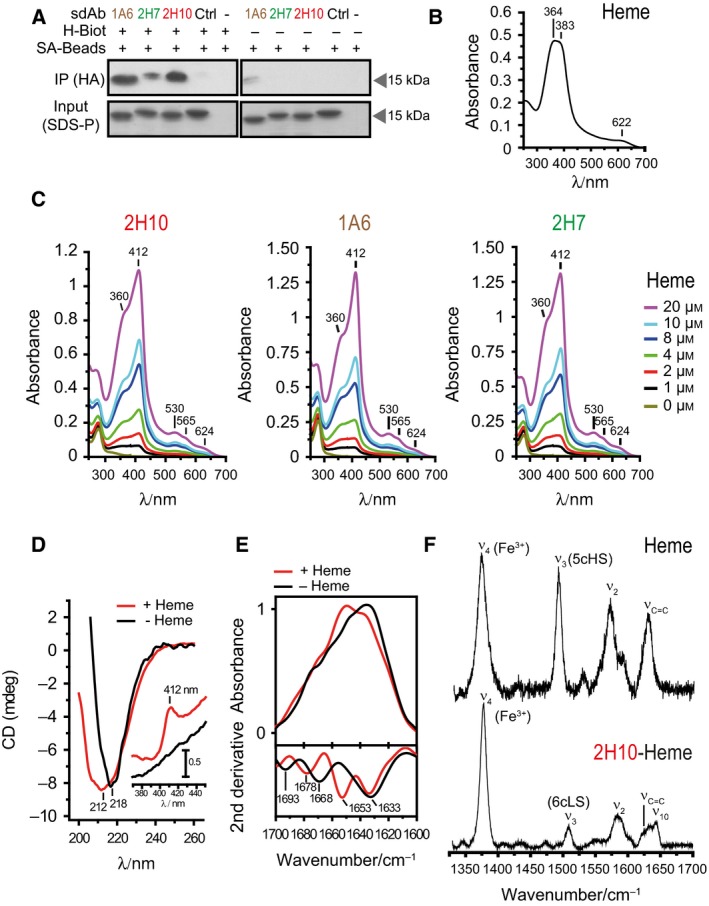
Analysis of heme binding by SdAbs. (A) SdAbs bound to biotinylated‐heme in solution were pooled‐down using streptavidin (SA) beads and detected by western blot using anti‐HA mAb. Input was measured by Coomassie‐based stain. (B) UV‐Visible spectra of hemin. Soret region at approximately 364 and 383 nm and a CT band at 622 nm are shown, representative of three independent experiments. (C) UV‐visible spectra of sdAb 2H10, 1A6 and 2H7 bound to heme at different concentrations. Soret (412 nm), Q1 (530 nm), Q0 (565 nm), and CT (624 nm) bands are highlighted. (D) Far UV CD spectra of sdAb 2H10 in the apo (black) and heme‐bound (red) forms. Shift from 212 to 218 is due to heme‐driven conformational rearrangement of the sdAb secondary structure. The inset shows the Soret region, with the appearance of the 412 nm band, due to heme binding to the sdAb. (E) ATR FTIR absorption spectra (top) and second derivative (bottom) of sdAb 2H10 in the apo (black) and heme‐bound (red) forms in the amide I region (1700–1610 cm−1), showing structural modification upon heme coordination. (F) High frequency Resonance Raman spectra of hemin and sdAb 2H10 bound to hemin, obtained with 413 nm excitation.
