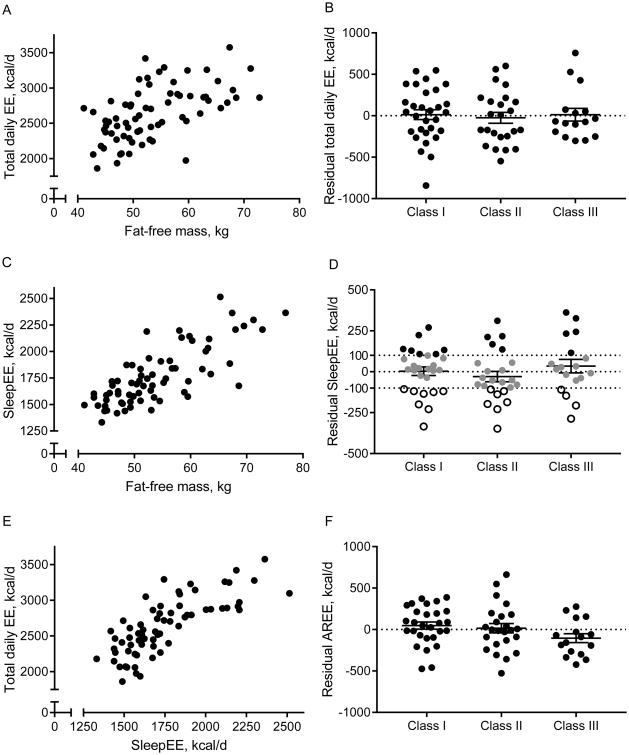
Figure 1.
Correlations between fat-free mass, sleeping and total daily energy expenditure (A, C, E) and residuals for total daily energy expenditure (TDEE, B), sleeping EE (SleepEE, D), and activity-related EE (AREE, F), by obesity class. Each data point represents one participant. For residual SleepEE, -100 kcal/d and 100 kcal/d are used to identify low and high metabolism.

