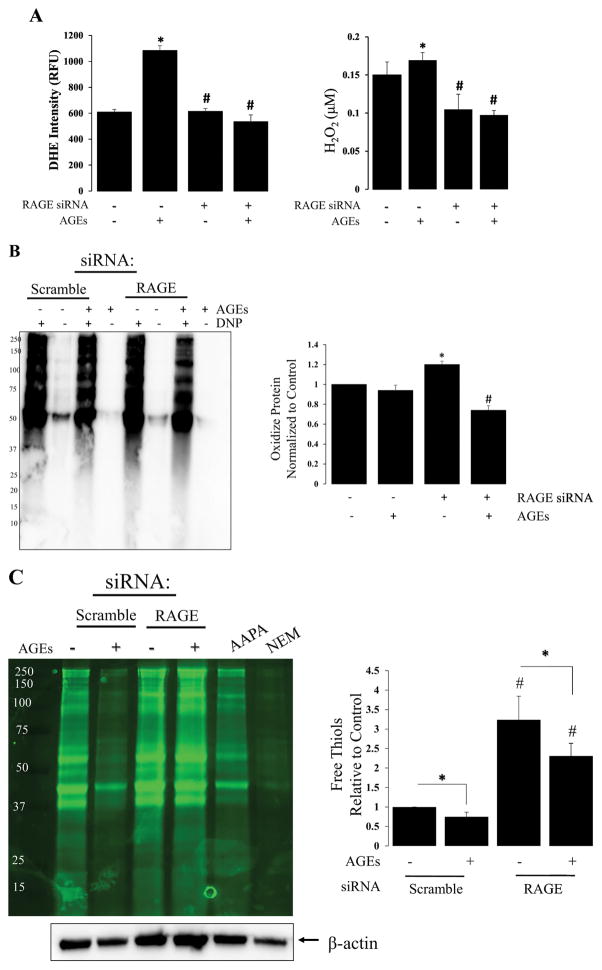
Figure 4. RAGE signaling is redox regulated.
(A) Bar graph demonstrating the effect of AGEs on superoxide and H2O2 production in R3/1 cells (± RAGE knockdown); N=3, *=p<0.05 compared, * = p<0.01 compared to scramble; # = P<0.05 compared to scramble with AGEs. (B) OxyBlot of RAGE dependent protein oxidation with associated bar graph demonstrating a ~30% reduction in protein oxidation with RAGE knockdown; N=4, *=p<0.05 compared to scramble; #= p<0.05 compared to scramble with AGEs. (C) Representative western blot of F5M labeled free thiols from scramble and RAGE knock-down groups ± AGEs; AAPA, R,R′-2-Acetylamino-3-[4-(2-acetylamino-2-carboxyethylsulfanylthiocarbonylamino)phenylthiocarbamoylsulfanyl]propionic acid hydrate, S, S′-[1,4-Phenylenebis(iminocarbonothioyl)]bis[N-acetyl-L-Cysteine] hydrate; NEM, N-ethyl malemide; Bar graph quantifying free thiols relative to β-actin; N=4, *= p<0.01 between groups, #= p<0.01 compared to control conditions.

