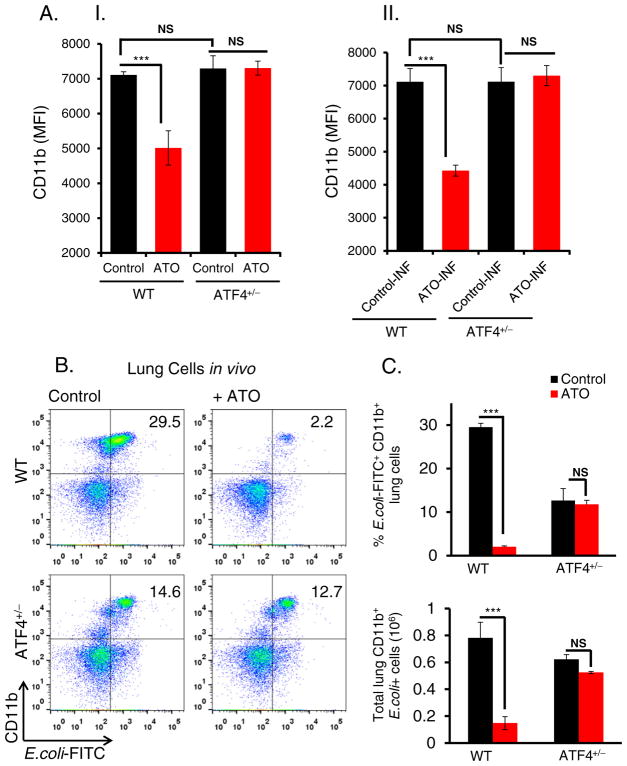
Fig. 2.
ATO down regulates CD11b expression in ATF4-dependent manner. (A); (A–I) Histogram showing mean fluorescent intensity of CD11b expression determined by flow cytometry analysis of peritoneal macrophages, isolated from WT and ATF4+/−heterozygous mice. These macrophages were treated with either saline (control) or ATO (2 μM for 14 h). (A–II) Similar experiments were also performed by infecting (INF) macrophages with E. coli fluorescents conjugated bioparticles. For this study, following treatment with ATO (2 μM for 14 h), peritoneal macrophages were incubated with E. coli (bacterial: cell, 50:1 ratio) at 37 °C for 2 h and then cells were washed twice with PBS followed by flow cytometry analysis. (B) Flow cytometry analysis of lung infiltrates of WT and ATF4+/− heterozygous mice treated intraperitoneally with either saline (control) or ATO (50 μg/mouse in 200 μl PBS; daily for 10 days) and then intratracheally infected with E. coli-FITC. Representative dot plots showing percentages of CD11b + E. coli-FITC+ cells in the lung tissues. (C) Histogram showing percent E. coli FITC+CD11b+ cells (top panel) and absolute numbers of E. coli-FITC+ CD11b+ cells (lower panel) in lung tissues. Data are expressed as mean ± SEM. ***P < 0.001 compared to their respective controls. NS-nonsignificant.

