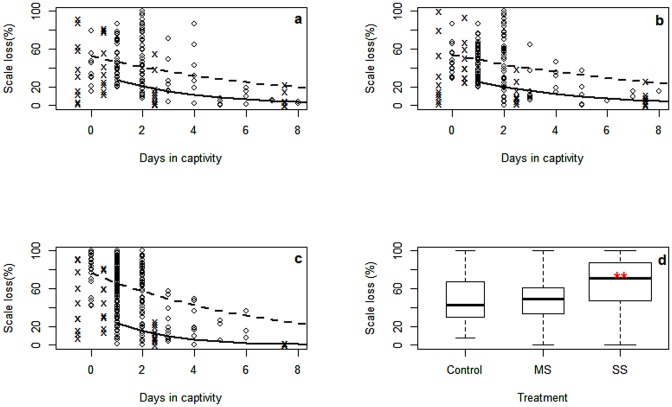
Fig 5. Sardine scale loss (%) during the first week in captivity, separately for fish sampled dead (O) and alive (x) in treatments a. control, b. modified slipping and c. standard slipping.
Sampling day for live fish is shifted by 0.5 days to improve clarity. Lines indicate fitted GLM (shown in Table 3; solid line, live fish; dashed line, dead fish). d. Distribution (boxplots) of scale loss for all sardines that died during capture (day-1) up to the first 2 days in captivity in the three sampled treatments (0-control; 1—modified slipping; 2—standard slipping). ** symbol indicates significance of SS treatment over the other two treatments (Kruskal-Wallis: H = 73.3, d.f. = 2, P<0.001).

