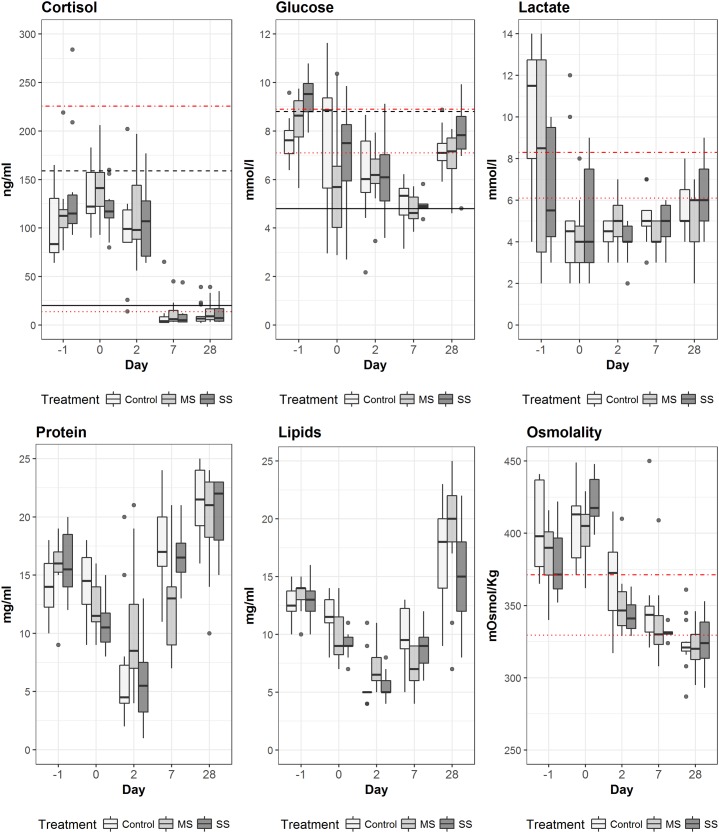
Fig 6. Evolution of physiological parameters in sardine blood plasma for each treatment (C – control; MS- modified slipping; SS – standard slipping) during the monitoring period are shown.
Black lines for cortisol and glucose are the mean for observations at the beginning (solid) and at the end of purse seine fishing operations (dashed) calculated from Marçalo et al. (2006); Red lines are the mean of observations for sardines sampled at day 49 for “low stress” (dotted) and “high stress” (dotdash).

